Fig. 17
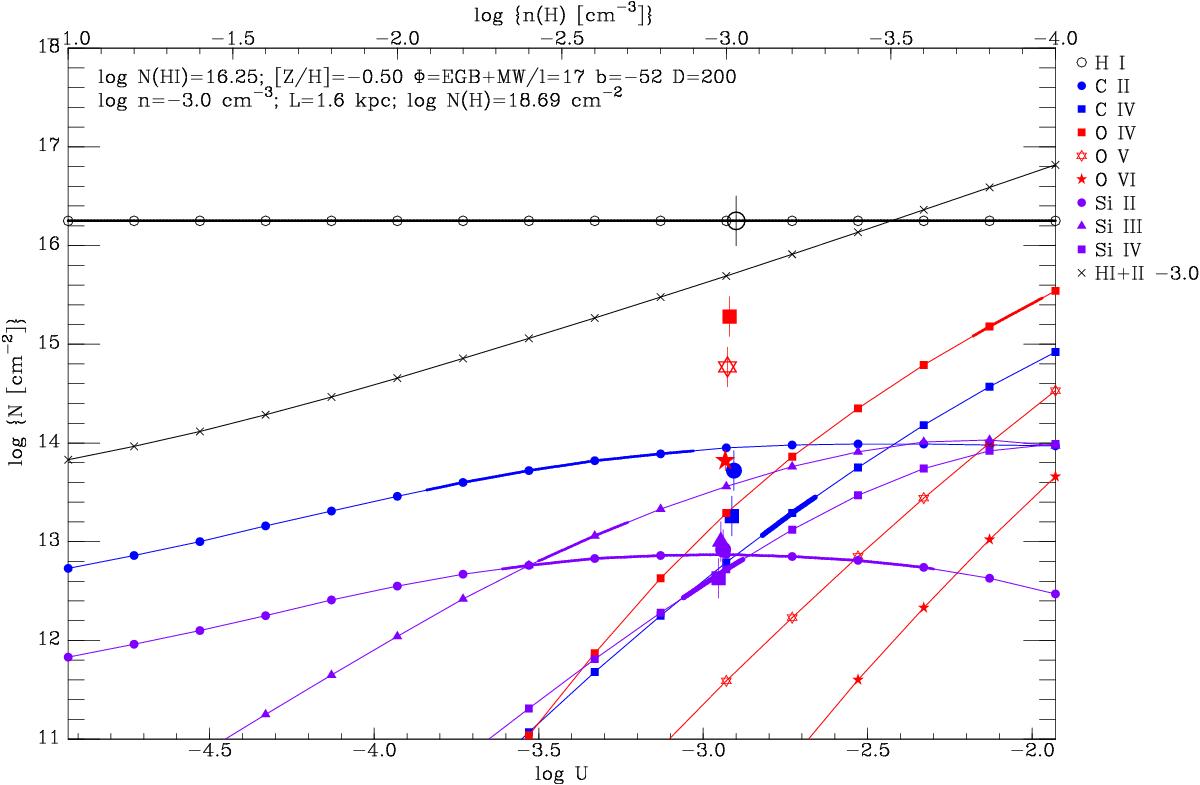
Predicted ionic column densities as a function of ionisation parameter U,calculated for a location 200 kpc from the Sun in the direction of PKS2155-304. Black lines and points indicate hydrogen; blue lines and points indicate carbon, red indicate oxygen, and purple indicate silicon. Circles indicate C ii and Si ii, triangles for Si iii, squares indicate C iv and O iv, and stars indicate O v. The observed values are indicated by the larger symbols near log U = −3.0, at which value both C iv and Si iv match the observations. The thick parts of the lines show where the prediction matches the range of observed values.
Current usage metrics show cumulative count of Article Views (full-text article views including HTML views, PDF and ePub downloads, according to the available data) and Abstracts Views on Vision4Press platform.
Data correspond to usage on the plateform after 2015. The current usage metrics is available 48-96 hours after online publication and is updated daily on week days.
Initial download of the metrics may take a while.