Fig. 8
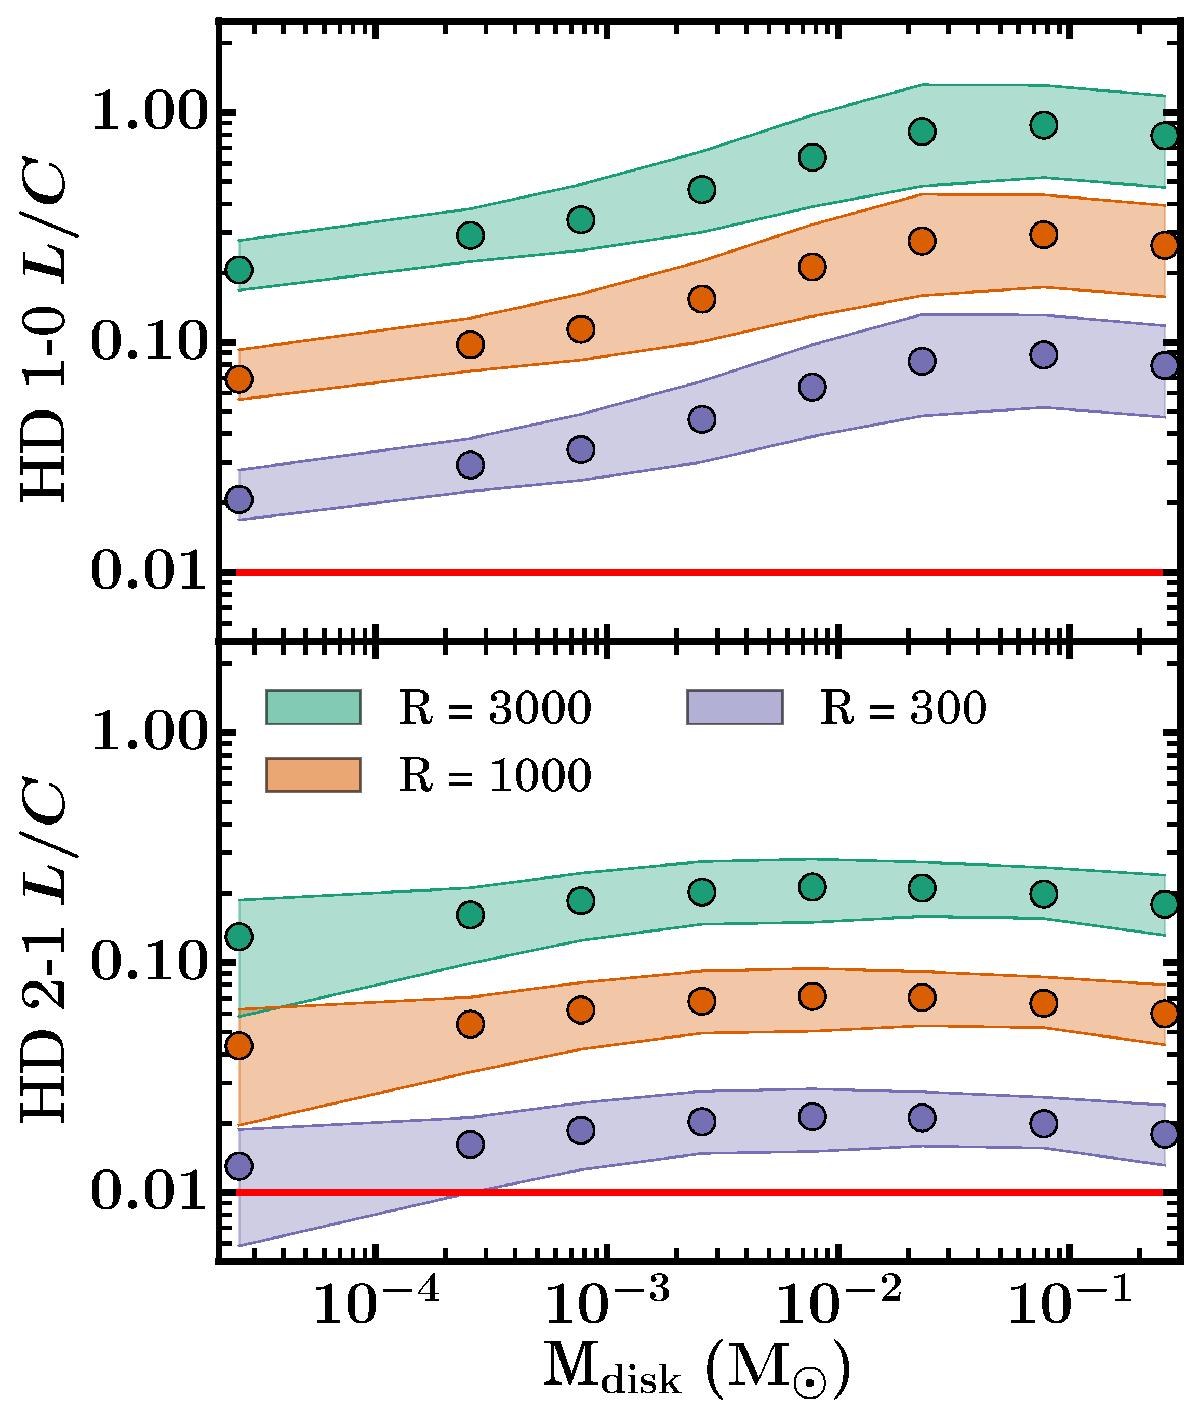
Line-to-continuum ratios of HD as functions of Mdisk for different spectral resolving powers. The points show the median L/C of the models in the mass bin. The shaded region shows the L/Cs between the 16th and 84th percentile in each mass bin. The red line represents a 3σ detection limit of L/C= 0.01, which is equivalent to assuming a S/N on the continuum of 300.
Current usage metrics show cumulative count of Article Views (full-text article views including HTML views, PDF and ePub downloads, according to the available data) and Abstracts Views on Vision4Press platform.
Data correspond to usage on the plateform after 2015. The current usage metrics is available 48-96 hours after online publication and is updated daily on week days.
Initial download of the metrics may take a while.