Fig. 7
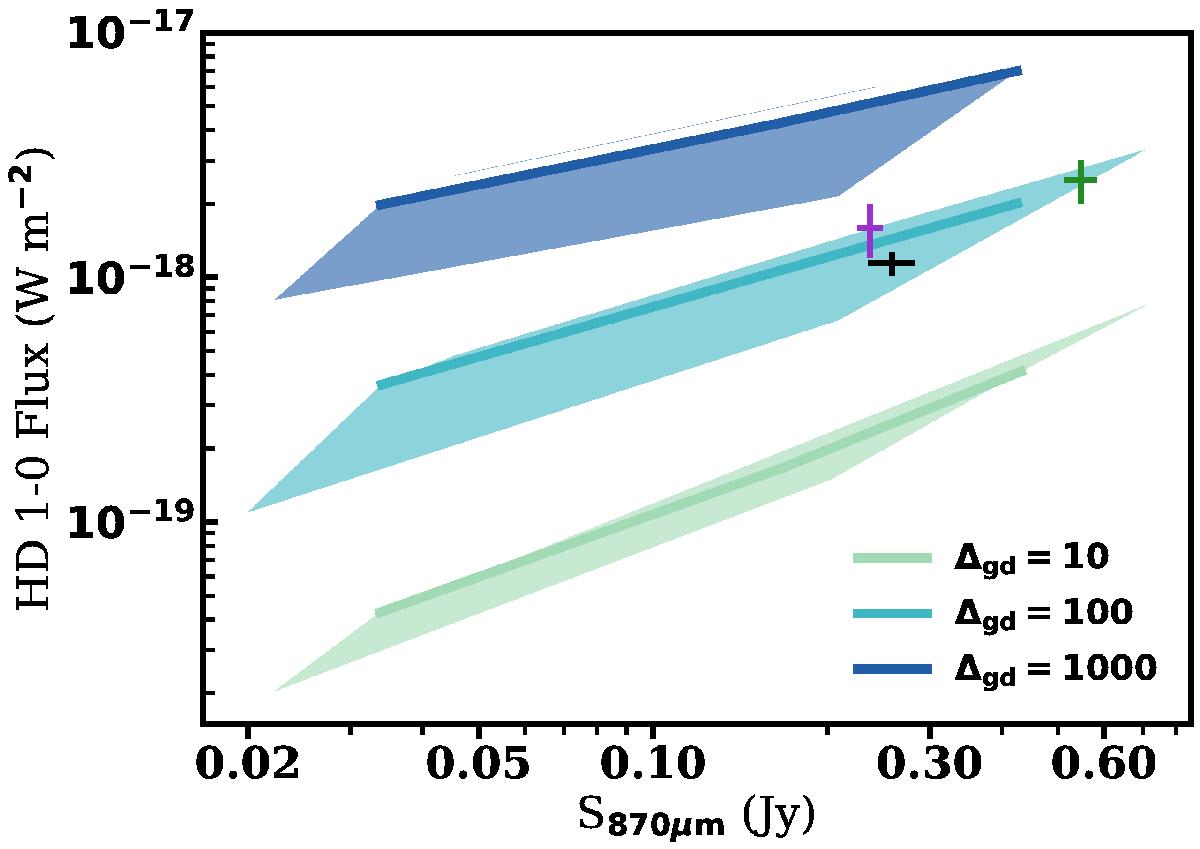
HD 1–0 integrated fluxes and 870 μm continuum flux densities for the models described in Table 4. Colours indicate various gas-to-dust ratios, where the shaded region shows the flux variations from different vertical structures. For each Δgd, the coloured line shows models with (ψ,hc) = (0.3, 0.1). The crosses denote observations for TW Hya (black; Bergin et al. 2013; Andrews et al. 2012), DM Tau (purple; McClure et al. 2016; Andrews et al. 2013) and GM Aur (green; McClure et al. 2016; Andrews et al. 2013). Both the model fluxes and the observations were scaled to a distance of 140 pc.
Current usage metrics show cumulative count of Article Views (full-text article views including HTML views, PDF and ePub downloads, according to the available data) and Abstracts Views on Vision4Press platform.
Data correspond to usage on the plateform after 2015. The current usage metrics is available 48-96 hours after online publication and is updated daily on week days.
Initial download of the metrics may take a while.