Fig. 2
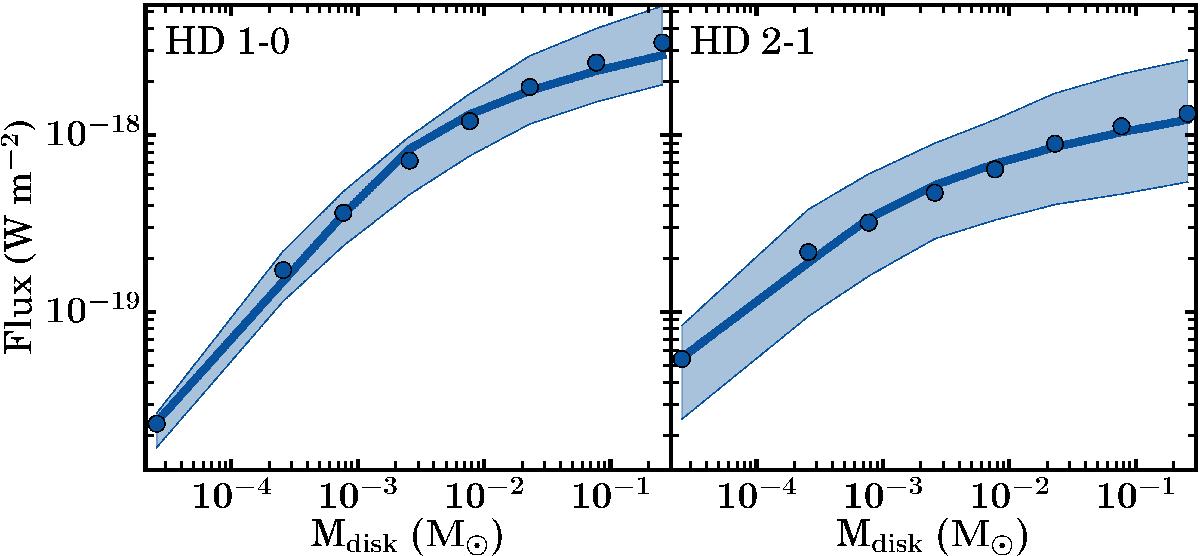
Left panel: integrated line flux (calculated at 140 pc) of the HD 1–0 transition as a function of disk mass. The points show the median flux of the models in that mass bin. The blue shaded region shows fluxes between the 16th and 84th percentiles in the same mass bin. The blue line shows the fit of Eq. (6)using the values from Table 3. Right panel: integrated line flux (calculated at 140 pc) of the HD 2–1 transition as a function of disk mass.
Current usage metrics show cumulative count of Article Views (full-text article views including HTML views, PDF and ePub downloads, according to the available data) and Abstracts Views on Vision4Press platform.
Data correspond to usage on the plateform after 2015. The current usage metrics is available 48-96 hours after online publication and is updated daily on week days.
Initial download of the metrics may take a while.