Fig. C.2
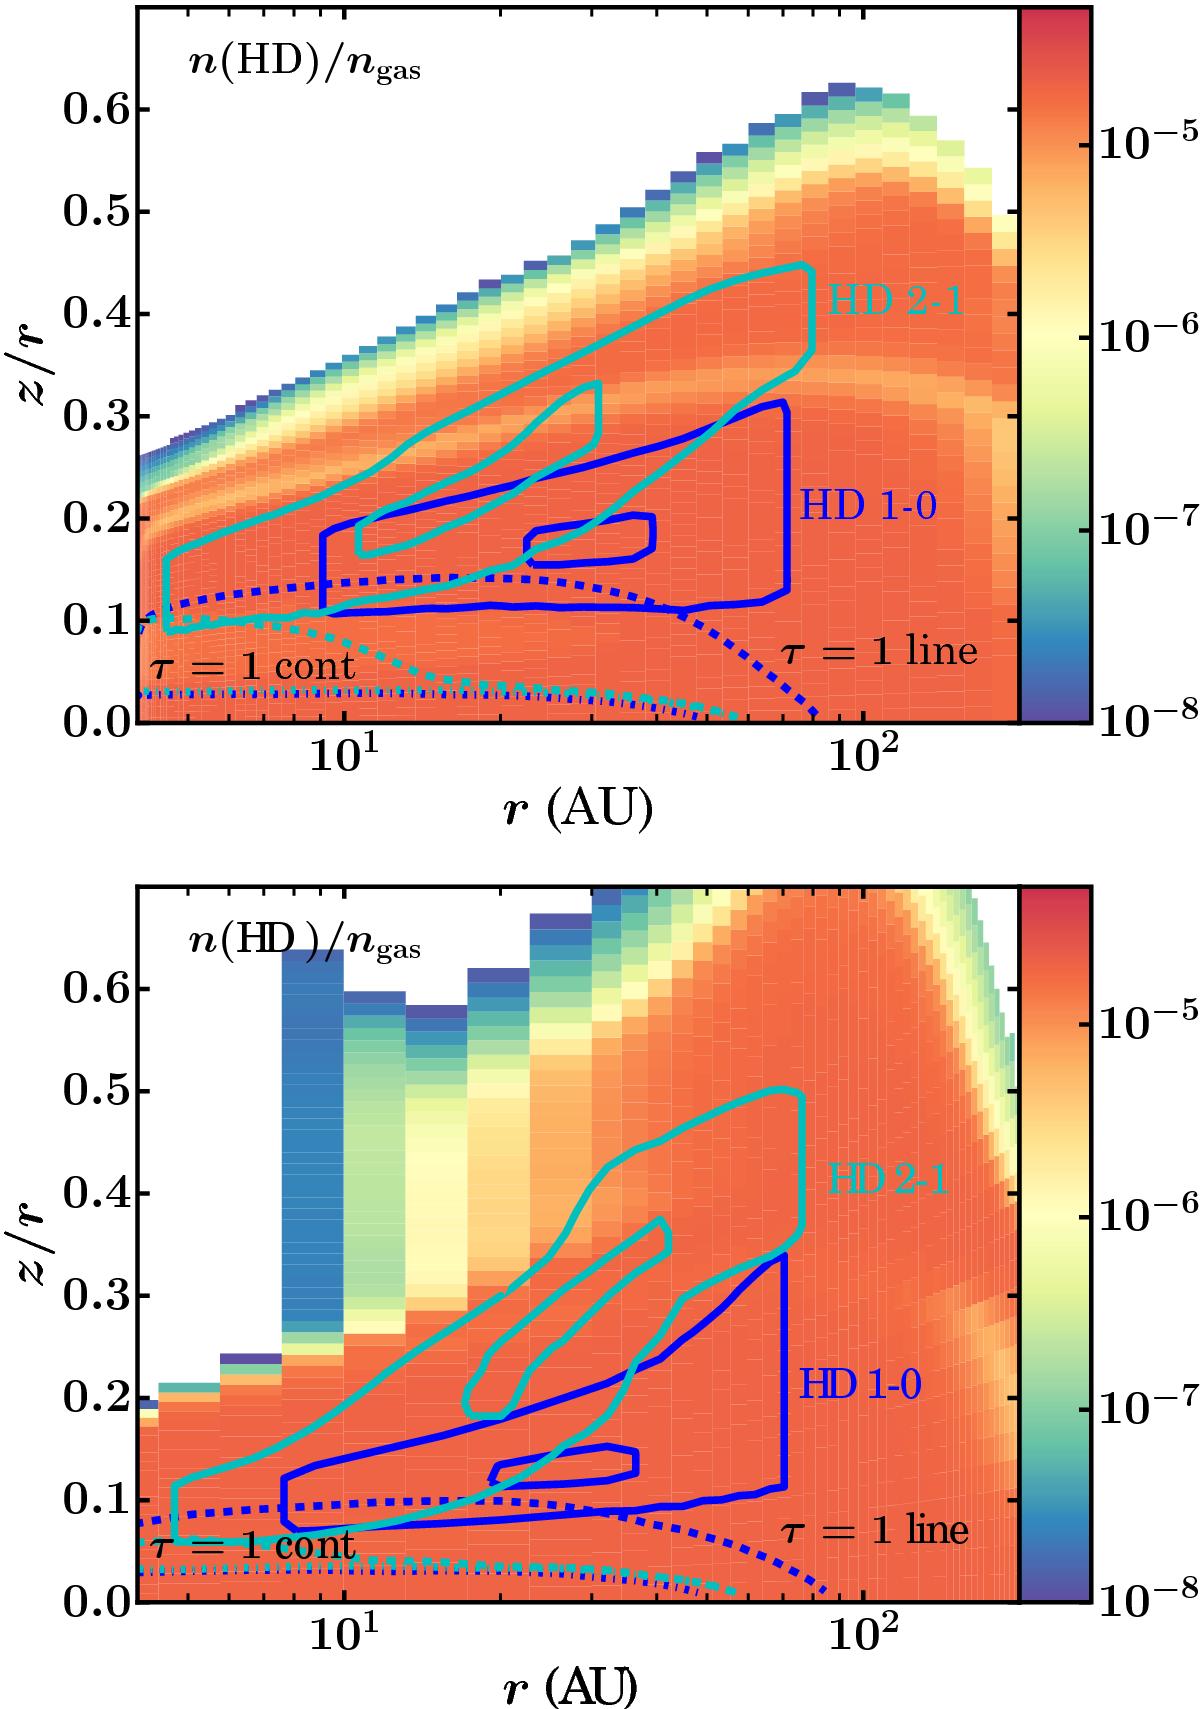
Top panel: HD abundance structure for a disk model, with Mdisk = 2.3×10⁻²M⊙, ψ = 0.3 and hc = 0.1, which is identical to Fig. 3. Colour indicates the number density of HD with respect to the total gas density. The coloured lines correspond the HD 1–0 (blue) and HD 2–1 (light blue), respectively. Solid contours indicate where 25% and 75% of the emission originates from. The dashed (dash-dotted) lines show the τ = 1 surface for the line and continuum opacity, respectively. Bottom panel: HD abundance structure of the same initial model, where the vertical structure is now determined by eight iterations of the hydrostatic solver of DALI.
Current usage metrics show cumulative count of Article Views (full-text article views including HTML views, PDF and ePub downloads, according to the available data) and Abstracts Views on Vision4Press platform.
Data correspond to usage on the plateform after 2015. The current usage metrics is available 48-96 hours after online publication and is updated daily on week days.
Initial download of the metrics may take a while.