Free Access
Fig. A.2
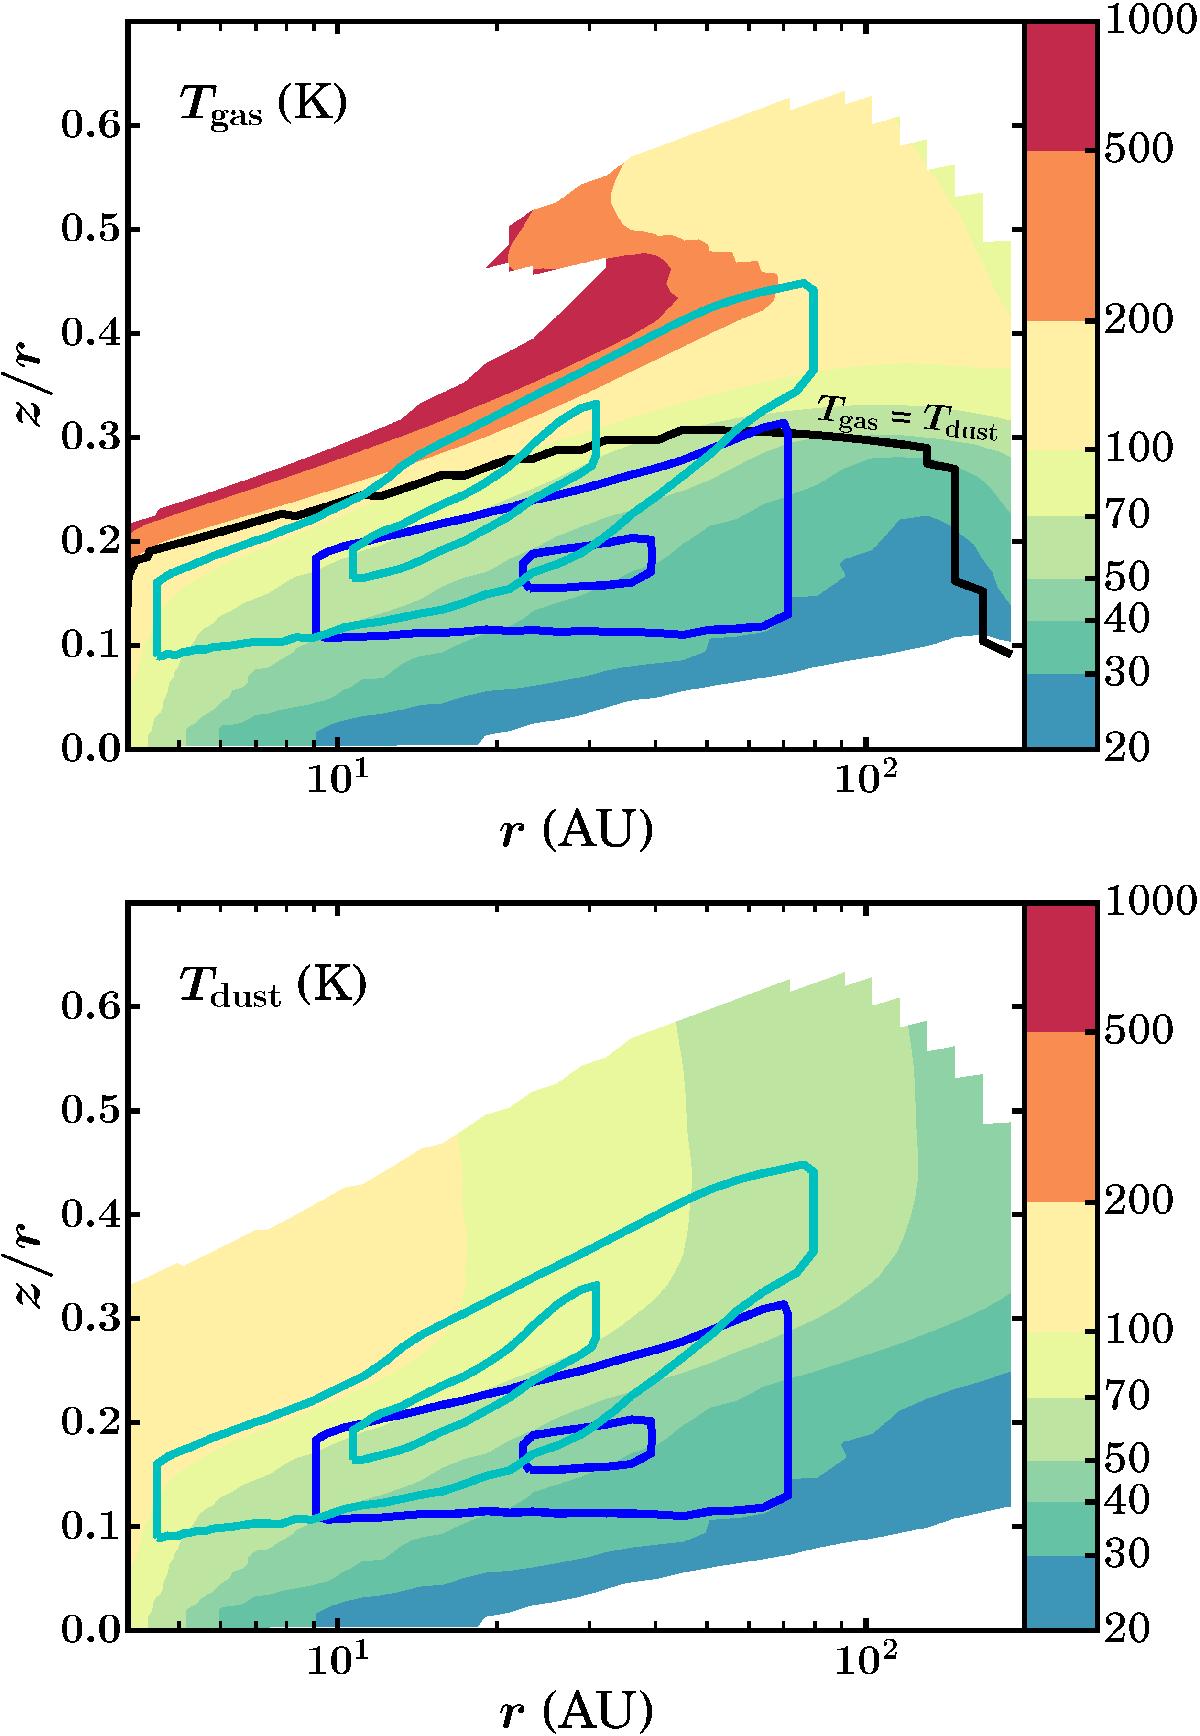
Maps of the gas temperature (top) and dust temperature (bottom). The solid lines denote where 25% and 75% of the emission from HD 1–0 (blue) and HD 2–1 (light blue) originate from. The region below the black line in the top panel is where Tgas = Tdust.
This figure is made of several images, please see below:
Current usage metrics show cumulative count of Article Views (full-text article views including HTML views, PDF and ePub downloads, according to the available data) and Abstracts Views on Vision4Press platform.
Data correspond to usage on the plateform after 2015. The current usage metrics is available 48-96 hours after online publication and is updated daily on week days.
Initial download of the metrics may take a while.