Fig. 13
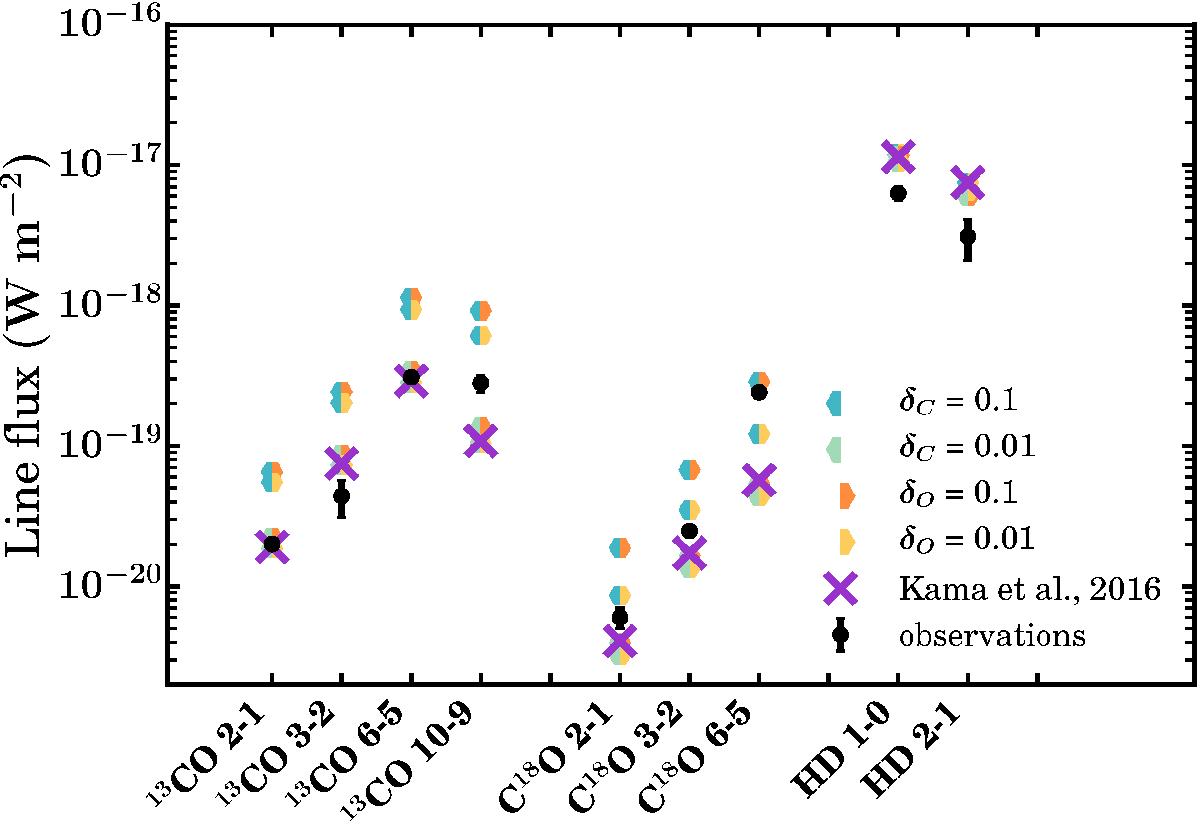
Integrated line fluxes from TW Hya models (Mdisk = 2.3 × 10⁻²M⊙, ψ = 0.3 and hc = 0.1) with different amounts of carbon depletion (hexagons; left side) and oxygen depletion (right side). The black bars show the observations for TW Hya (Schwarz et al. 2016; Kama et al. 2016b, and references therein). The purple crosses show the results from Kama et al. (2016b), recalculated for δC = δO = 0.01, [D]/[H] = 2 × 10⁻⁵ (cf. Sect. 4.4).
Current usage metrics show cumulative count of Article Views (full-text article views including HTML views, PDF and ePub downloads, according to the available data) and Abstracts Views on Vision4Press platform.
Data correspond to usage on the plateform after 2015. The current usage metrics is available 48-96 hours after online publication and is updated daily on week days.
Initial download of the metrics may take a while.