Fig. 10
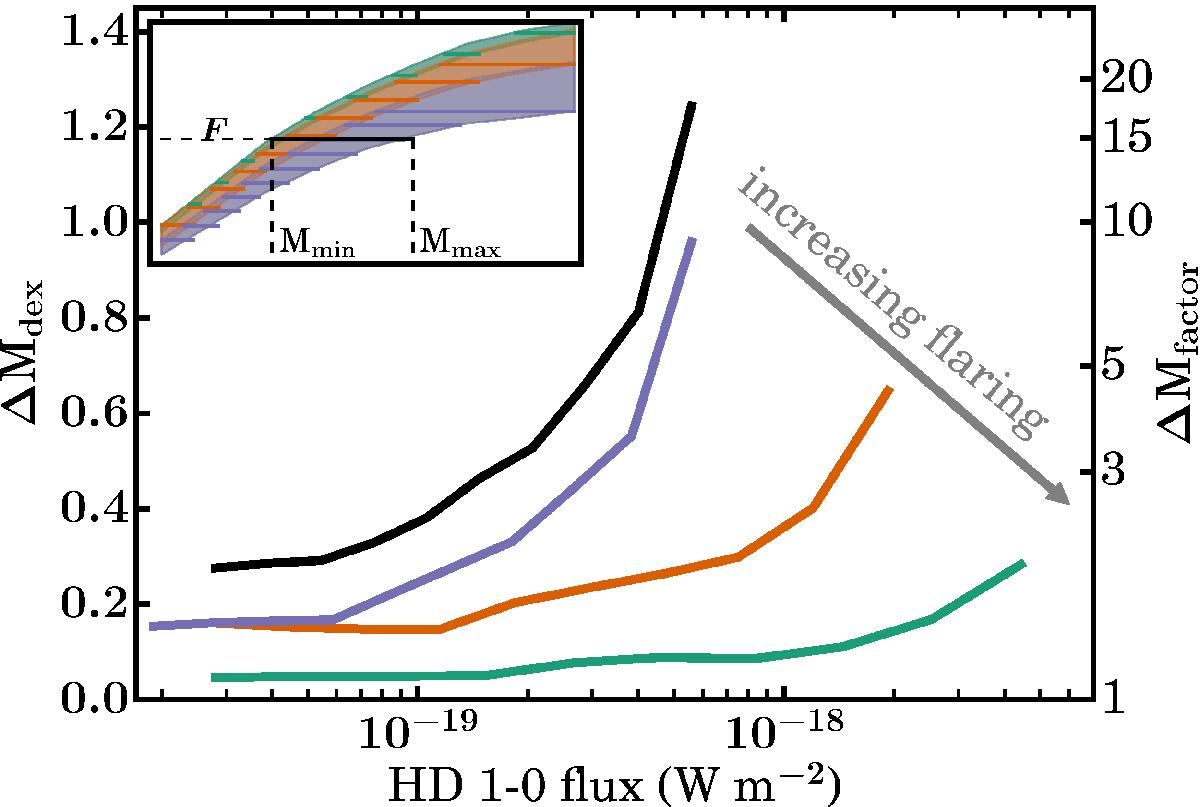
Calculated mass uncertainties (cf. Eq. (8)) as functions of HD 1–0 flux. The left and right vertical axis are related via ΔMfactor = 10ΔMdex. The black line shows the result if the full set of models is used (cf. Table 2). The other three lines show results for weakly flared (purple), intermediately flared (orange) and strongly flared (light green) disks (see Table 5 for definitions for these subsets). The subsets are also shown in the top left panel, which shows a scaled version of Fig. 2.
Current usage metrics show cumulative count of Article Views (full-text article views including HTML views, PDF and ePub downloads, according to the available data) and Abstracts Views on Vision4Press platform.
Data correspond to usage on the plateform after 2015. The current usage metrics is available 48-96 hours after online publication and is updated daily on week days.
Initial download of the metrics may take a while.