Fig. 4
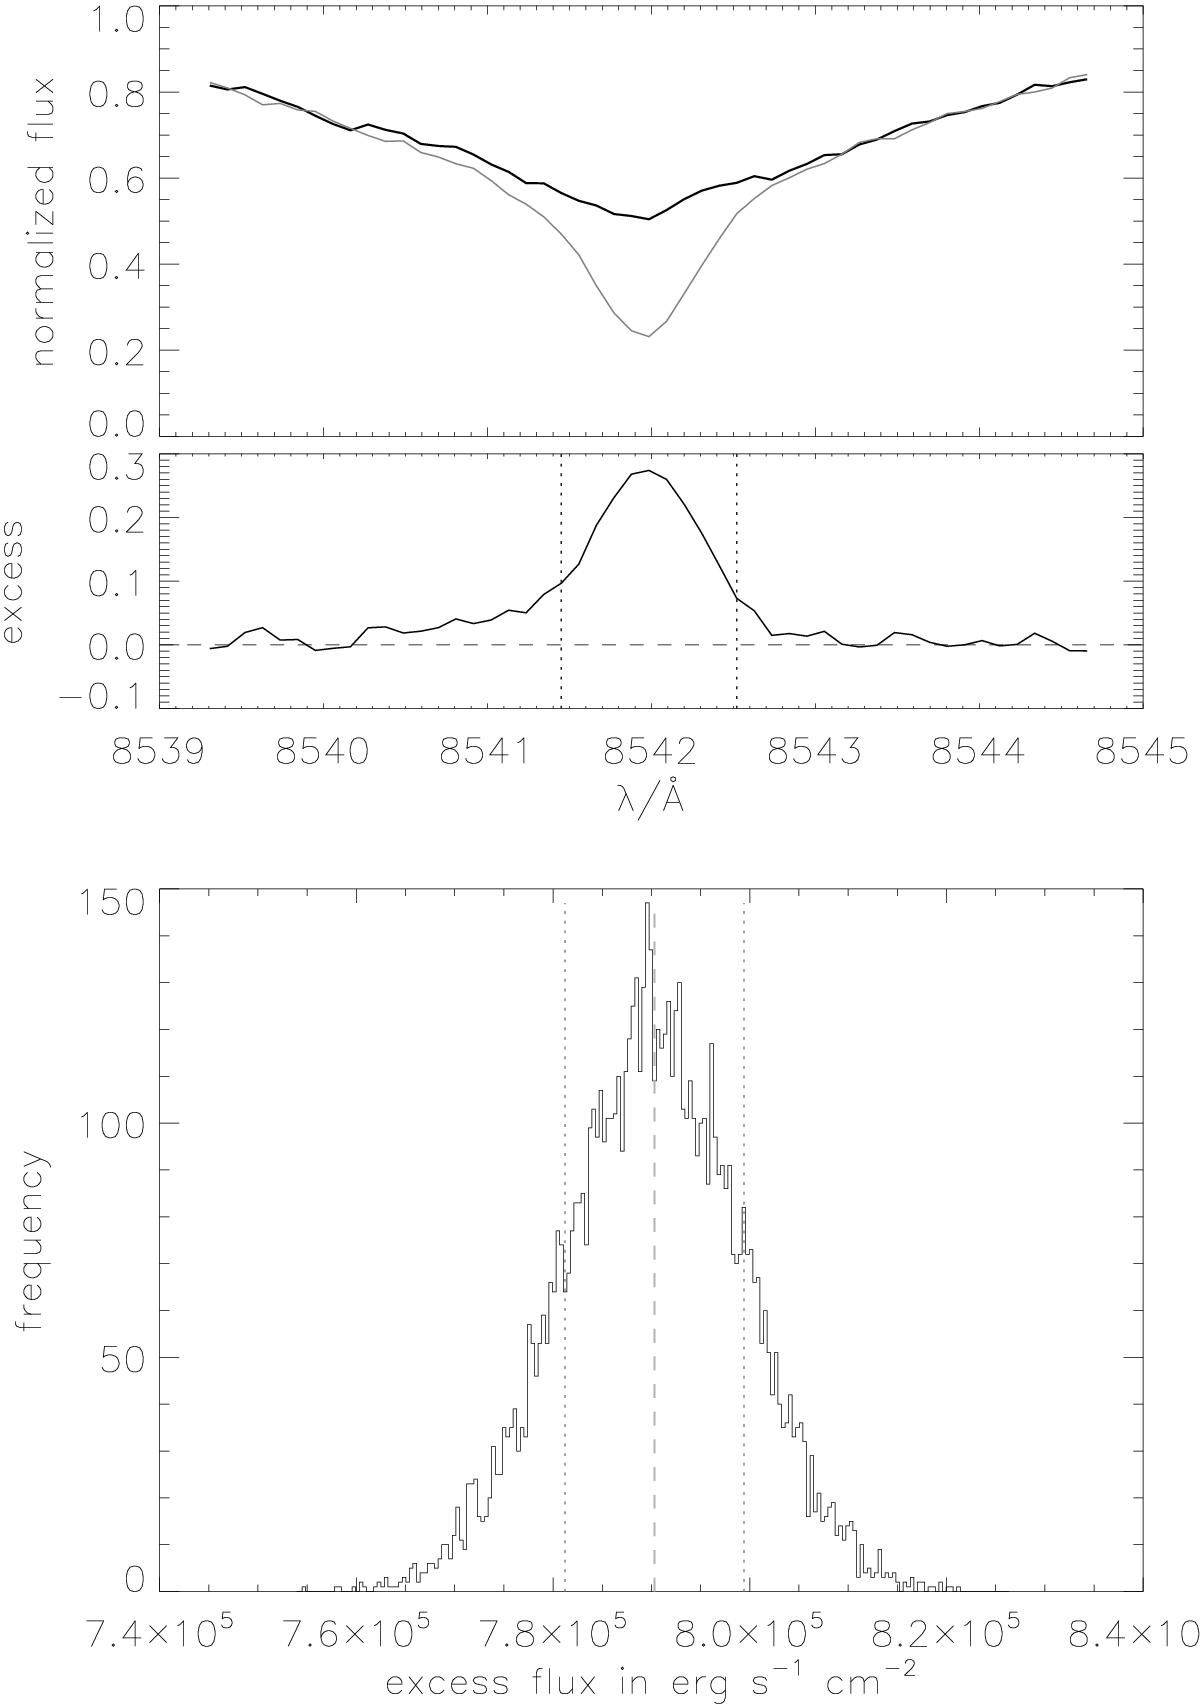
Determination of the excess flux measured for HD 152391 in the second Ca ii IRT line at 8542 Å and resulting distribution of the integrated excess flux after performing the Monte-Carlo-iterations. Top: comparison of the observation (black) with the rotationally broadened comparison spectrum (gray). The resulting excess flux, shifted to find an agreement in the wings, is shown in the lower plot. The dotted vertical lines show the 1 Å-region used for integrating. Bottom: histogram resulting from performing the excess flux determination 150 times, varying rotation and other parameters within their errors. The gray dashed line shows the average excess flux, the gray dotted lines the found 1σ values. Here, we found an excess flux of (7.9 ± 0.09) × 105 erg s-1 cm-2.
Current usage metrics show cumulative count of Article Views (full-text article views including HTML views, PDF and ePub downloads, according to the available data) and Abstracts Views on Vision4Press platform.
Data correspond to usage on the plateform after 2015. The current usage metrics is available 48-96 hours after online publication and is updated daily on week days.
Initial download of the metrics may take a while.