Fig. 3
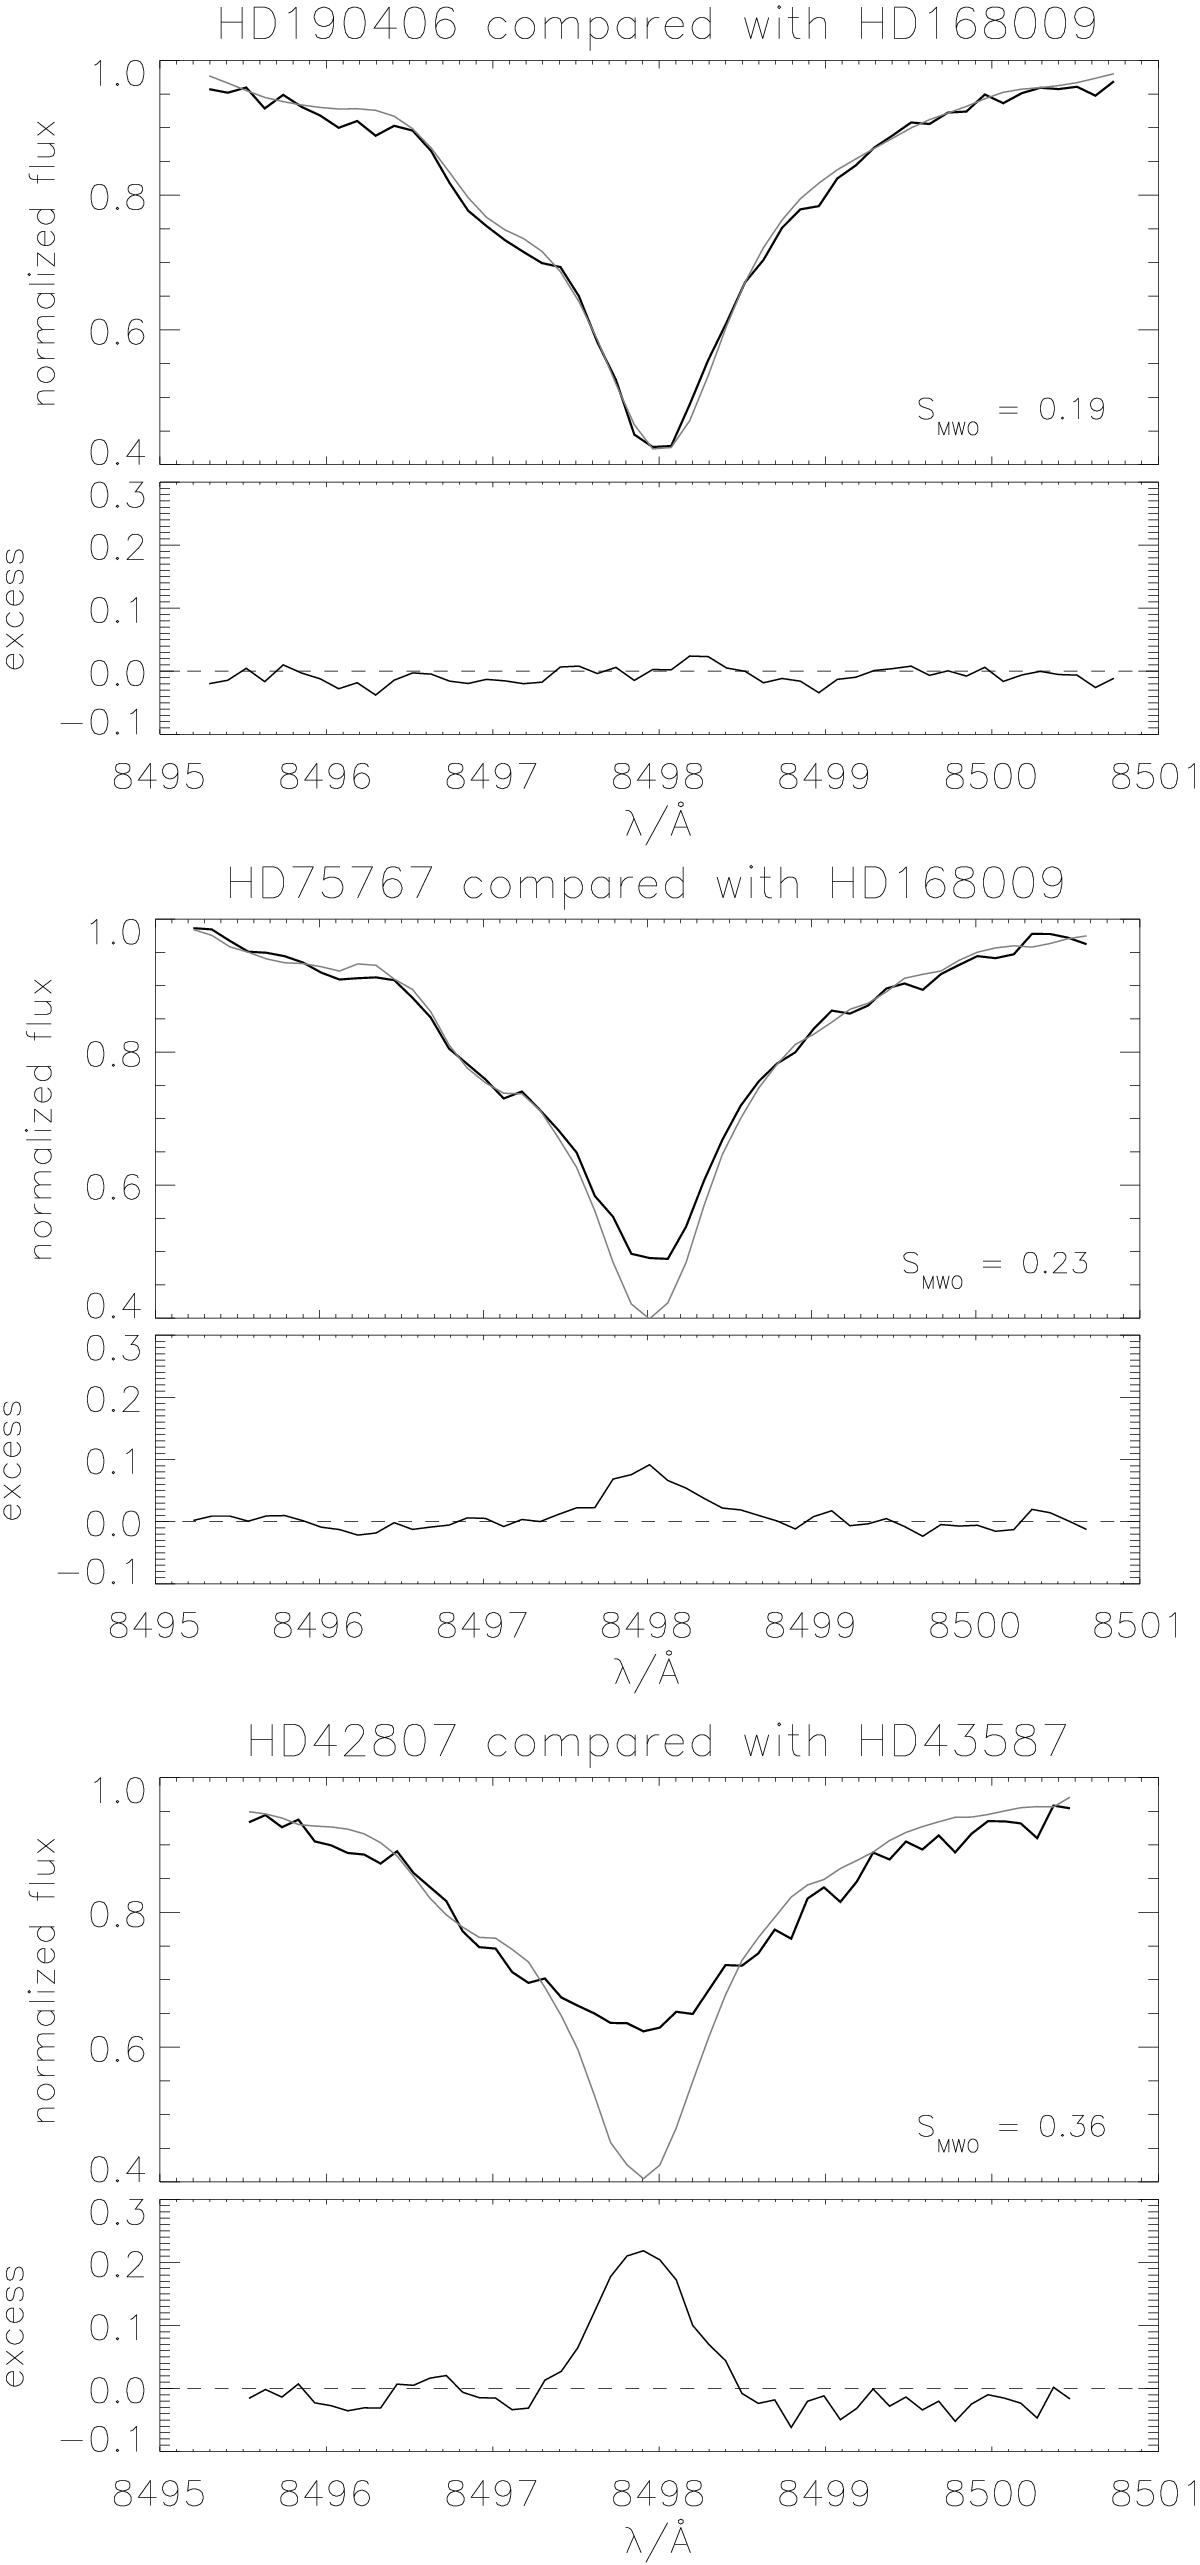
Comparison of different stars’ spectra (black) with the spectra of inactive stars (gray). For the lowest-activity stars (top), no excess flux can be seen, whereas for higher activity, the observed fill-in increases with activity. The determined excess flux in the first Ca ii line in these three cases are 0.1 × 10⁵ erg s-1 cm-2, 2.0 × 10⁵ erg s-1 cm-2 and 4.4 × 10⁵ erg s-1 cm-2.
Current usage metrics show cumulative count of Article Views (full-text article views including HTML views, PDF and ePub downloads, according to the available data) and Abstracts Views on Vision4Press platform.
Data correspond to usage on the plateform after 2015. The current usage metrics is available 48-96 hours after online publication and is updated daily on week days.
Initial download of the metrics may take a while.