Fig. 14
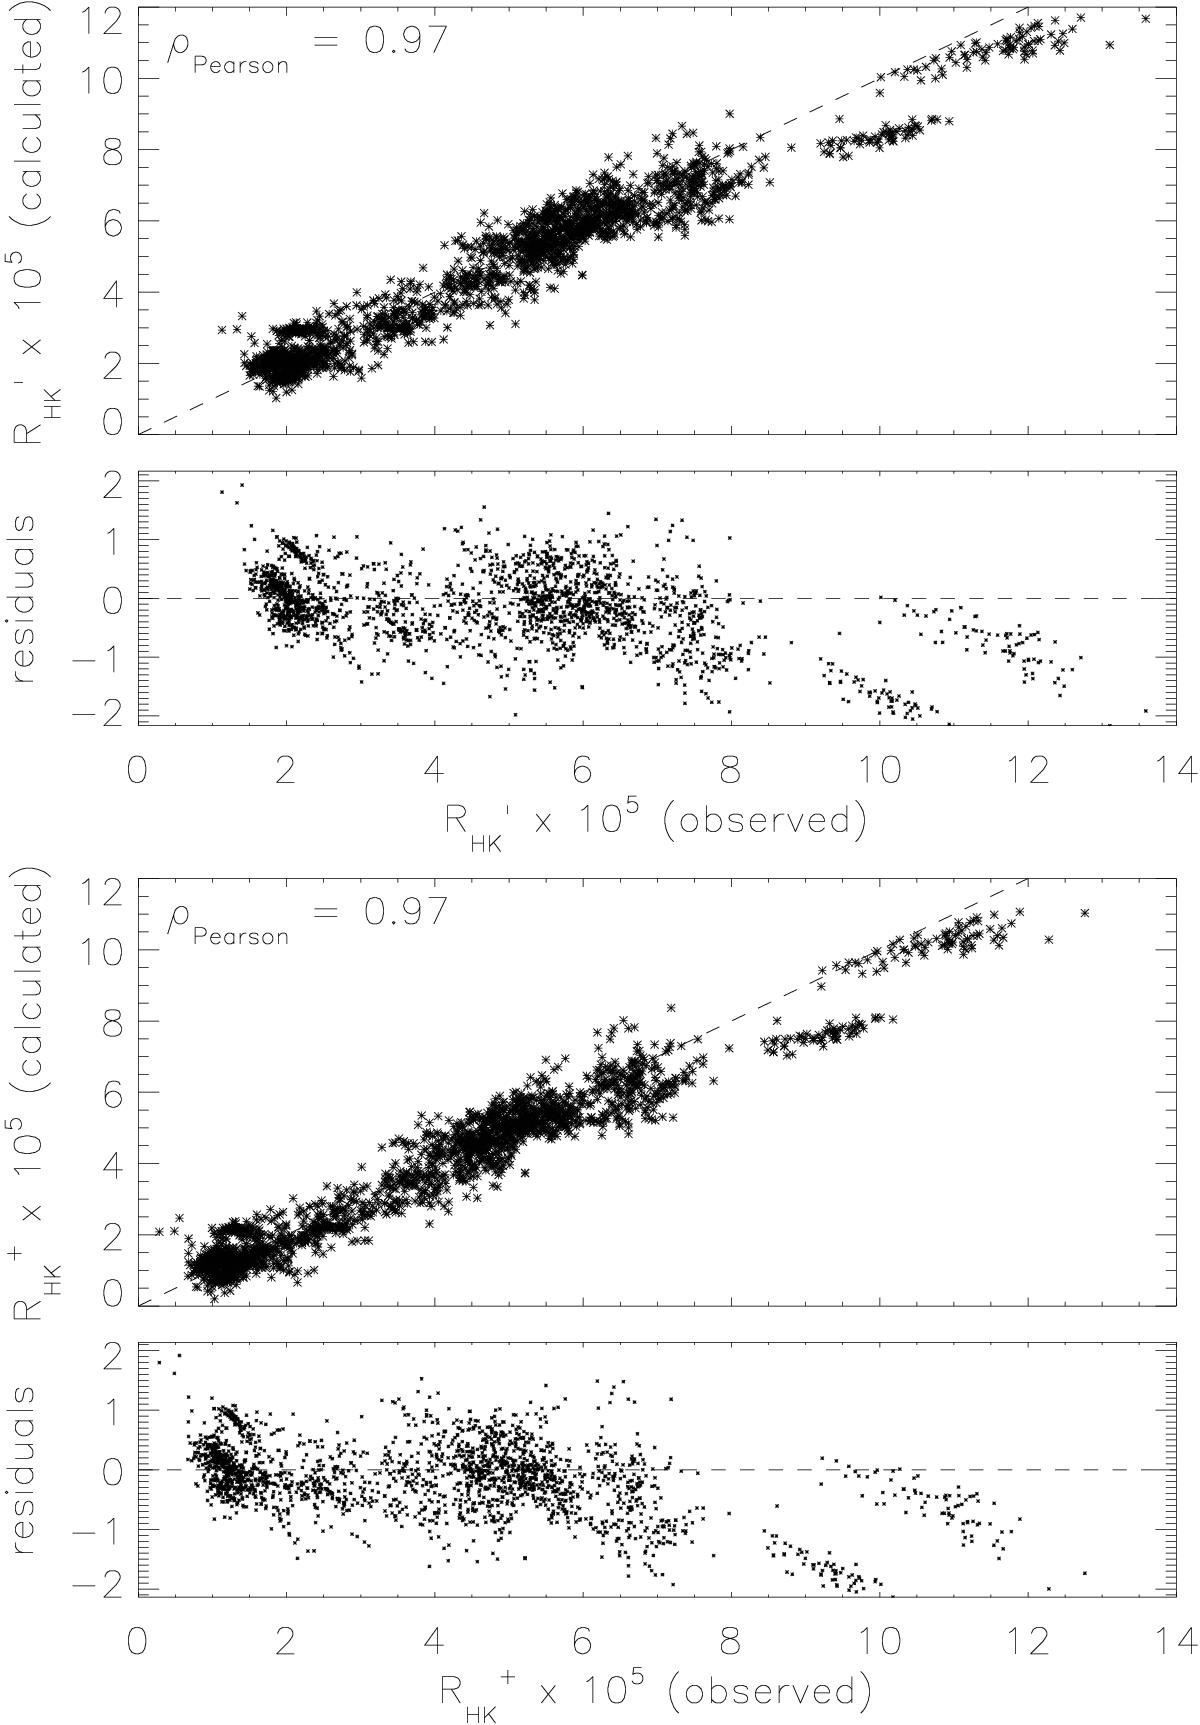
Comparison of the measured value for ![]() (top), resp.
(top), resp. ![]() (bottom) to the one converted from the excess flux in the Ca ii IRT lines, using Eqs. (10)and (11). These plots include data from 2076 observations of 76 stars. The dashed line corresponds to the identity relation (top), or the zero-level (bottom). The Pearson correlation coefficient of converted to observed values is 0.97 in both cases, indicating a good conversion.
(bottom) to the one converted from the excess flux in the Ca ii IRT lines, using Eqs. (10)and (11). These plots include data from 2076 observations of 76 stars. The dashed line corresponds to the identity relation (top), or the zero-level (bottom). The Pearson correlation coefficient of converted to observed values is 0.97 in both cases, indicating a good conversion.
Current usage metrics show cumulative count of Article Views (full-text article views including HTML views, PDF and ePub downloads, according to the available data) and Abstracts Views on Vision4Press platform.
Data correspond to usage on the plateform after 2015. The current usage metrics is available 48-96 hours after online publication and is updated daily on week days.
Initial download of the metrics may take a while.