Fig. 11
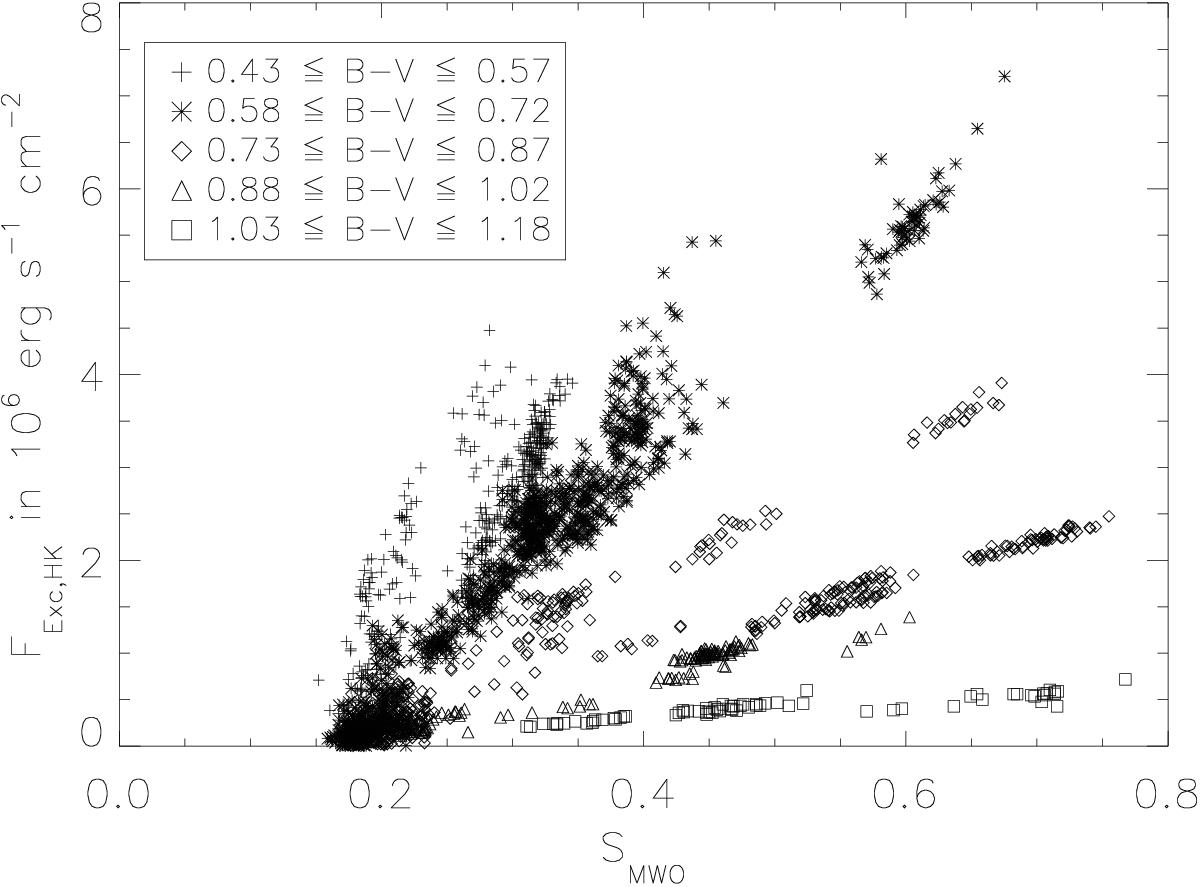
Measured excess flux in the Ca ii H and K lines as a function of SMWO. This plot shows data from 2154 observations of 80 stars. For reasons of clarity, we have removed HD 22468 from this plot, as it contributes a number of datapoints clustering around a value of SMWO ≈ 1.25, as well as some observations with a negative value of FExc,HK that is consistent with zero considering its error.
Current usage metrics show cumulative count of Article Views (full-text article views including HTML views, PDF and ePub downloads, according to the available data) and Abstracts Views on Vision4Press platform.
Data correspond to usage on the plateform after 2015. The current usage metrics is available 48-96 hours after online publication and is updated daily on week days.
Initial download of the metrics may take a while.