Fig. 2
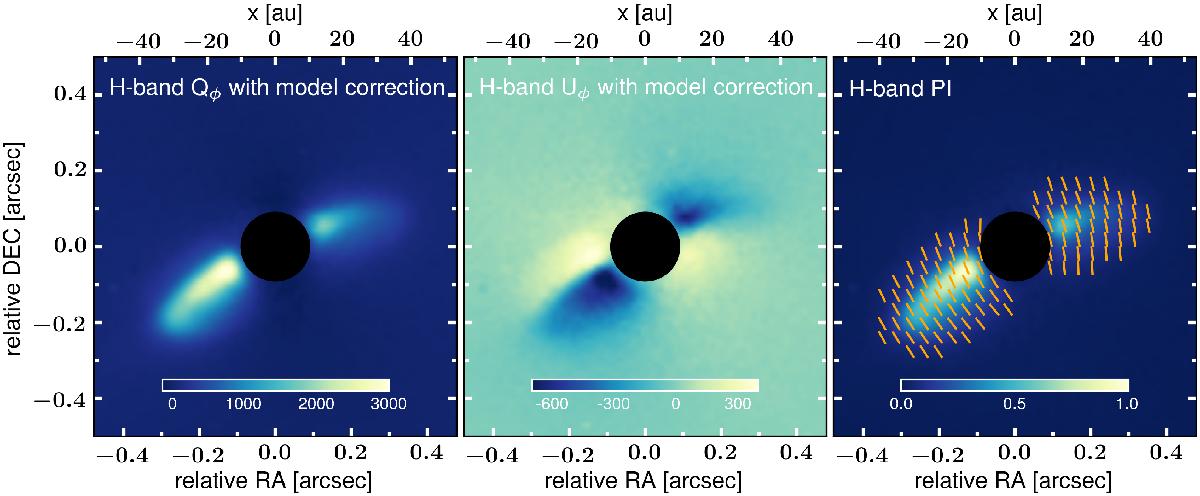
Mueller matrix model-corrected IRDIS-DPI Qφ (left), Uφ (middle) and polarized intensity ![]() (right) images. North is up, east is left. Note that the Qφ and Uφ images are not normalized/saturated here on purpose to emphasize their partially negative signal. The inner 0.̋18 are masked, represented by the black circular area. The orange stripes in the right image represent the angle of linear polarization (fixed length, not scaled with the degree of polarization).
(right) images. North is up, east is left. Note that the Qφ and Uφ images are not normalized/saturated here on purpose to emphasize their partially negative signal. The inner 0.̋18 are masked, represented by the black circular area. The orange stripes in the right image represent the angle of linear polarization (fixed length, not scaled with the degree of polarization).
Current usage metrics show cumulative count of Article Views (full-text article views including HTML views, PDF and ePub downloads, according to the available data) and Abstracts Views on Vision4Press platform.
Data correspond to usage on the plateform after 2015. The current usage metrics is available 48-96 hours after online publication and is updated daily on week days.
Initial download of the metrics may take a while.