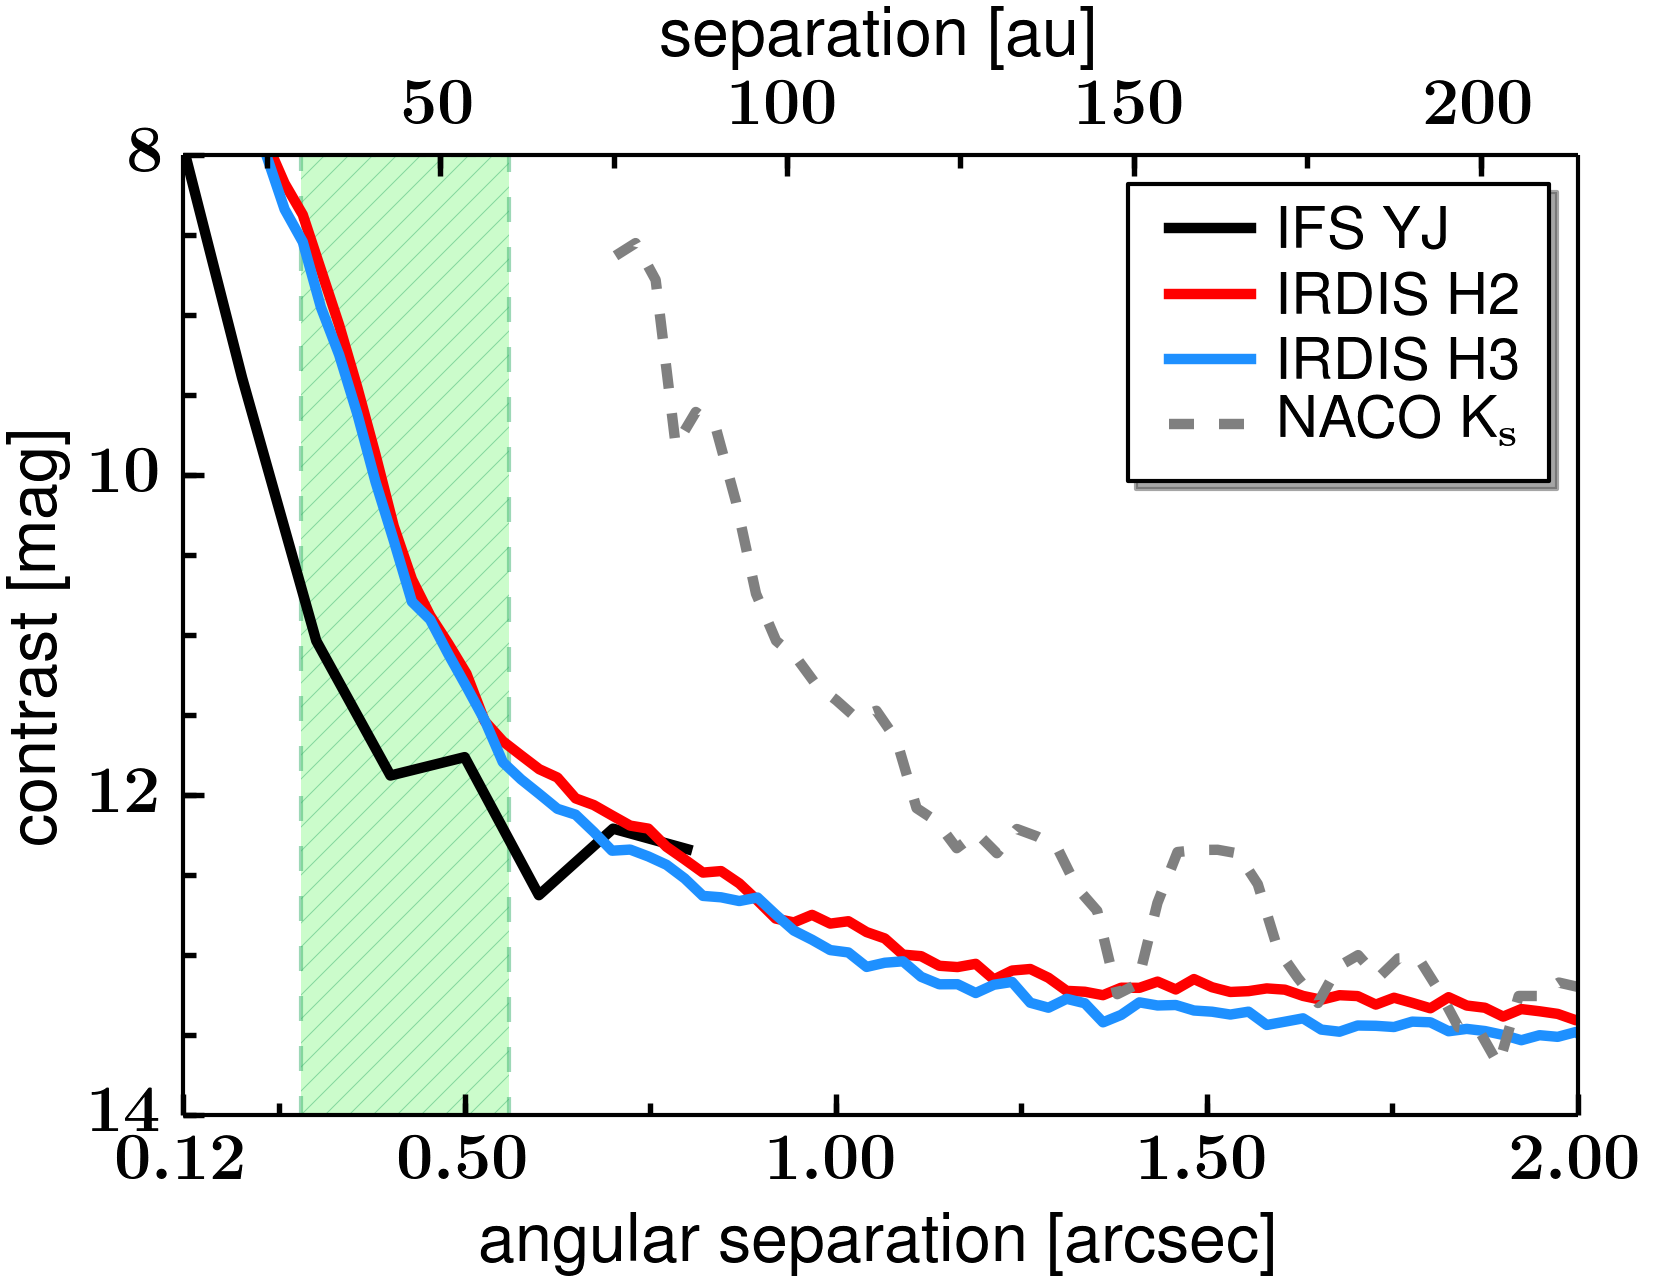
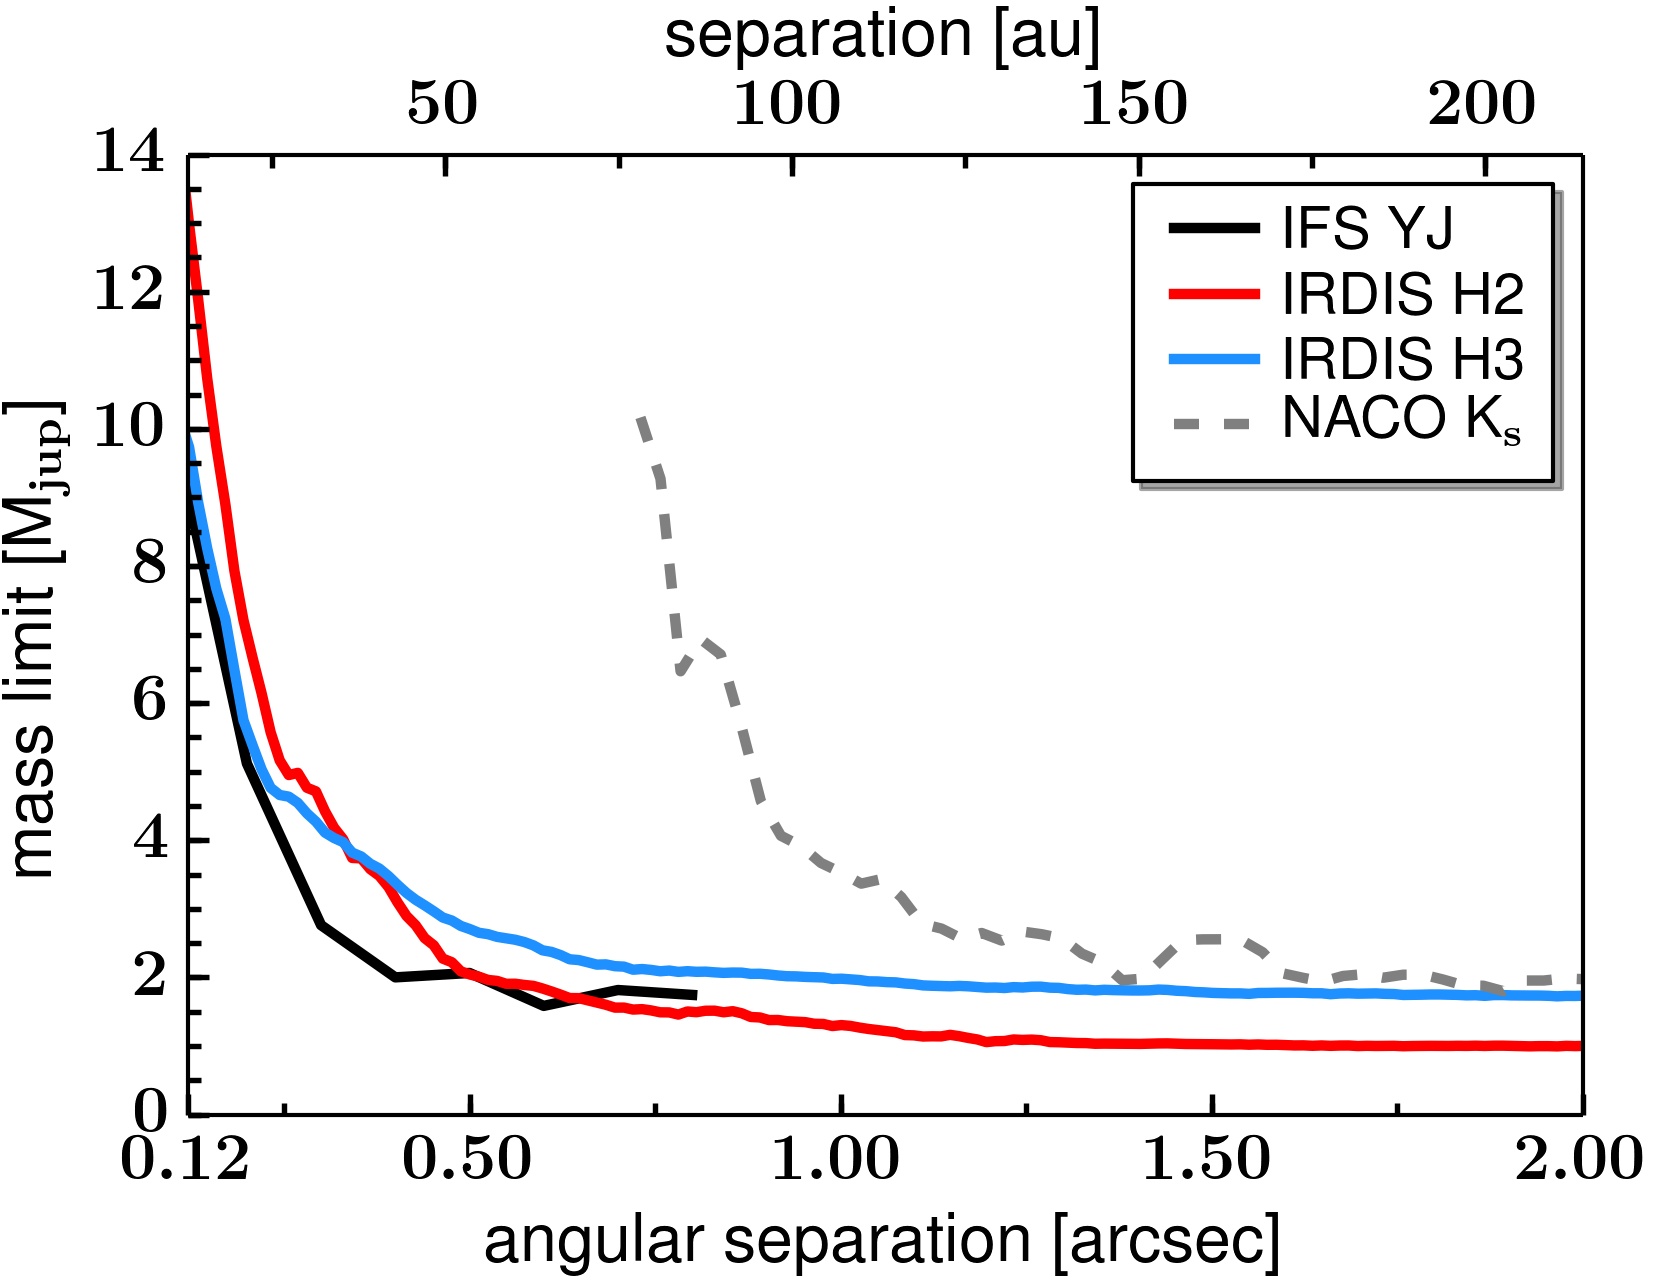
Fig. 13
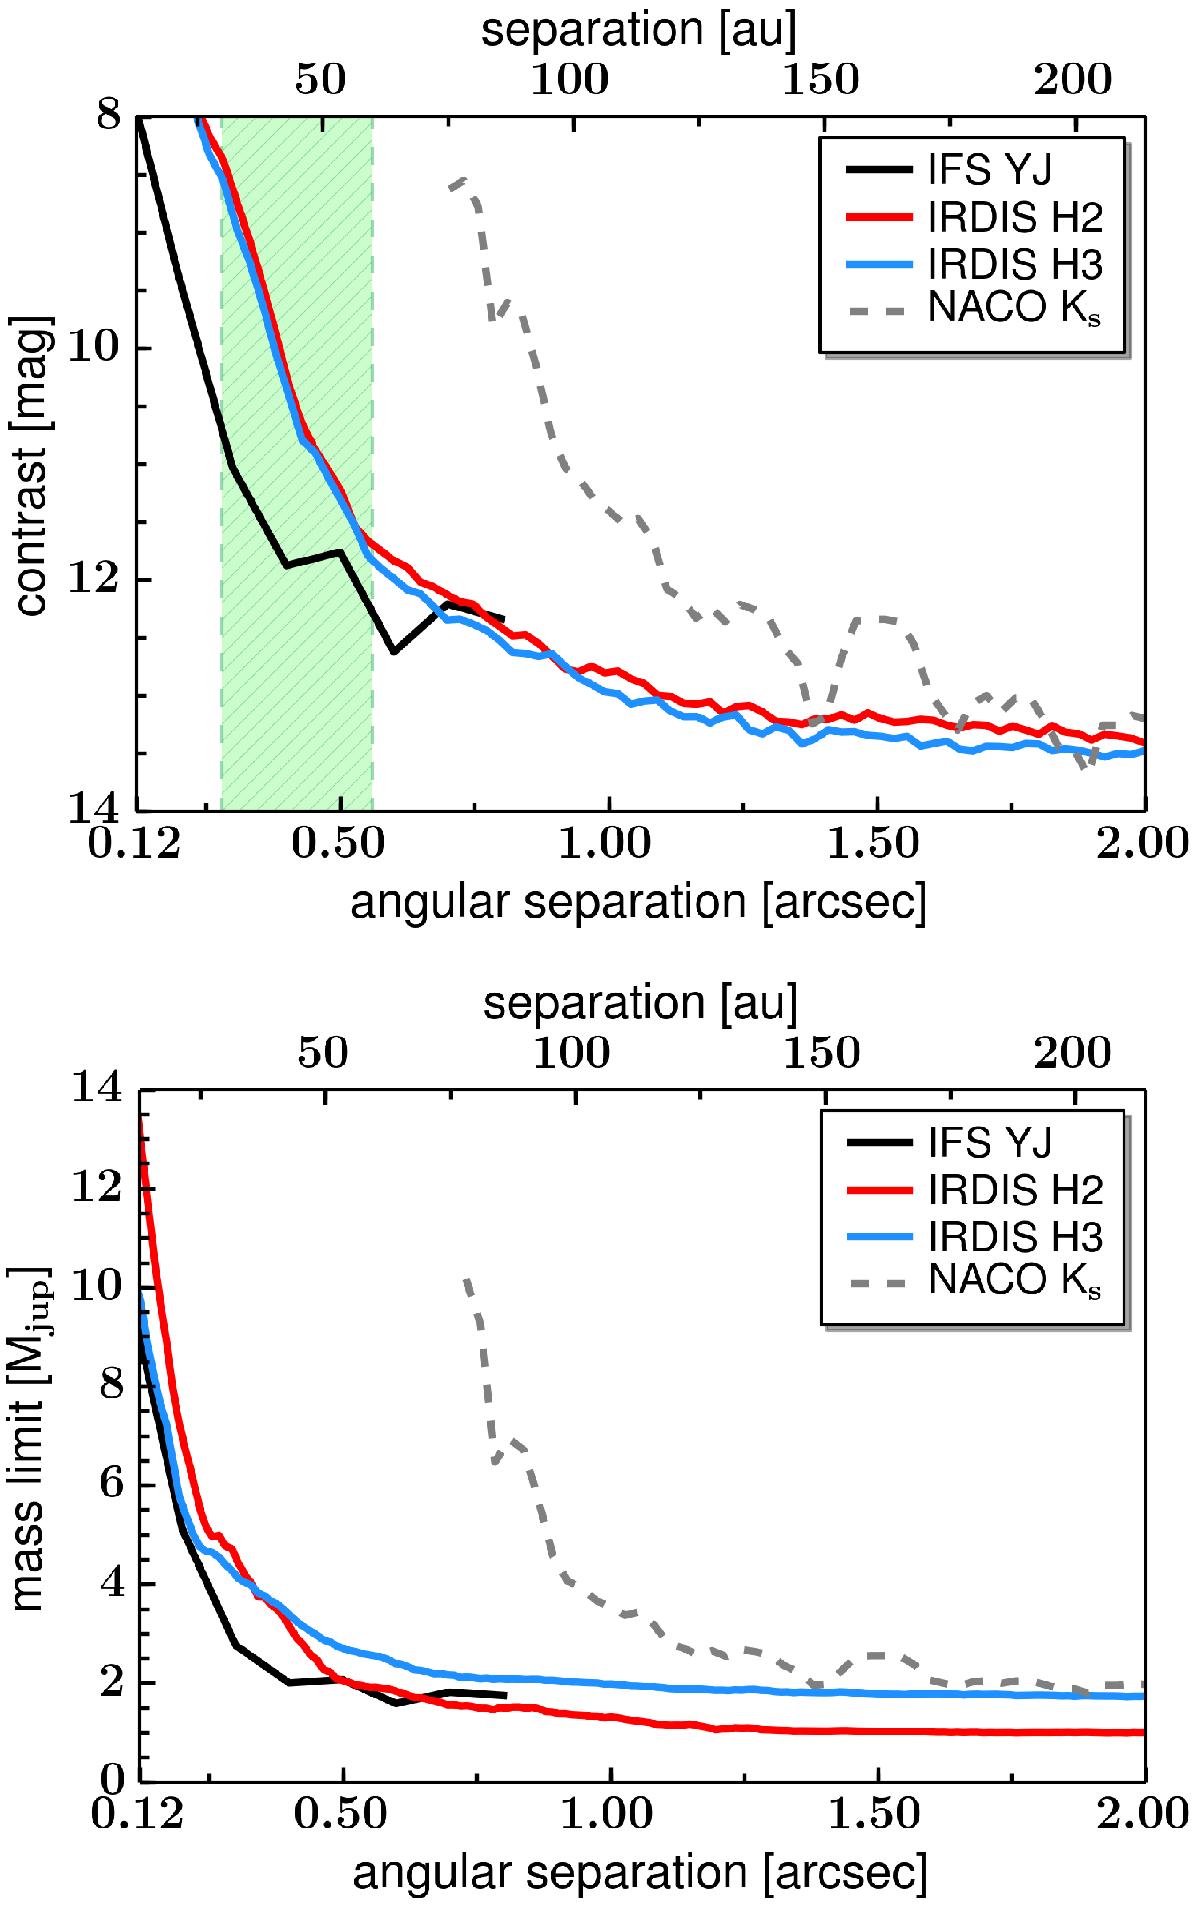
Contrast curves and companion mass limits derived for IFS (black) after applying PCA, and for IRDIS H2 and H3 bands (red and blue, respectively) from the TLOCI reduction (#3). Both curves have a lower cut at 0.̋12. The detection limits from NACO Ks band data are given for comparison (gray dashed line, inner cut at 0.̋7). The green striped rectangle denotes the area for which the contrast values might be slightly affected by the presence of the disk in scattered light.
Current usage metrics show cumulative count of Article Views (full-text article views including HTML views, PDF and ePub downloads, according to the available data) and Abstracts Views on Vision4Press platform.
Data correspond to usage on the plateform after 2015. The current usage metrics is available 48-96 hours after online publication and is updated daily on week days.
Initial download of the metrics may take a while.