Fig. 1
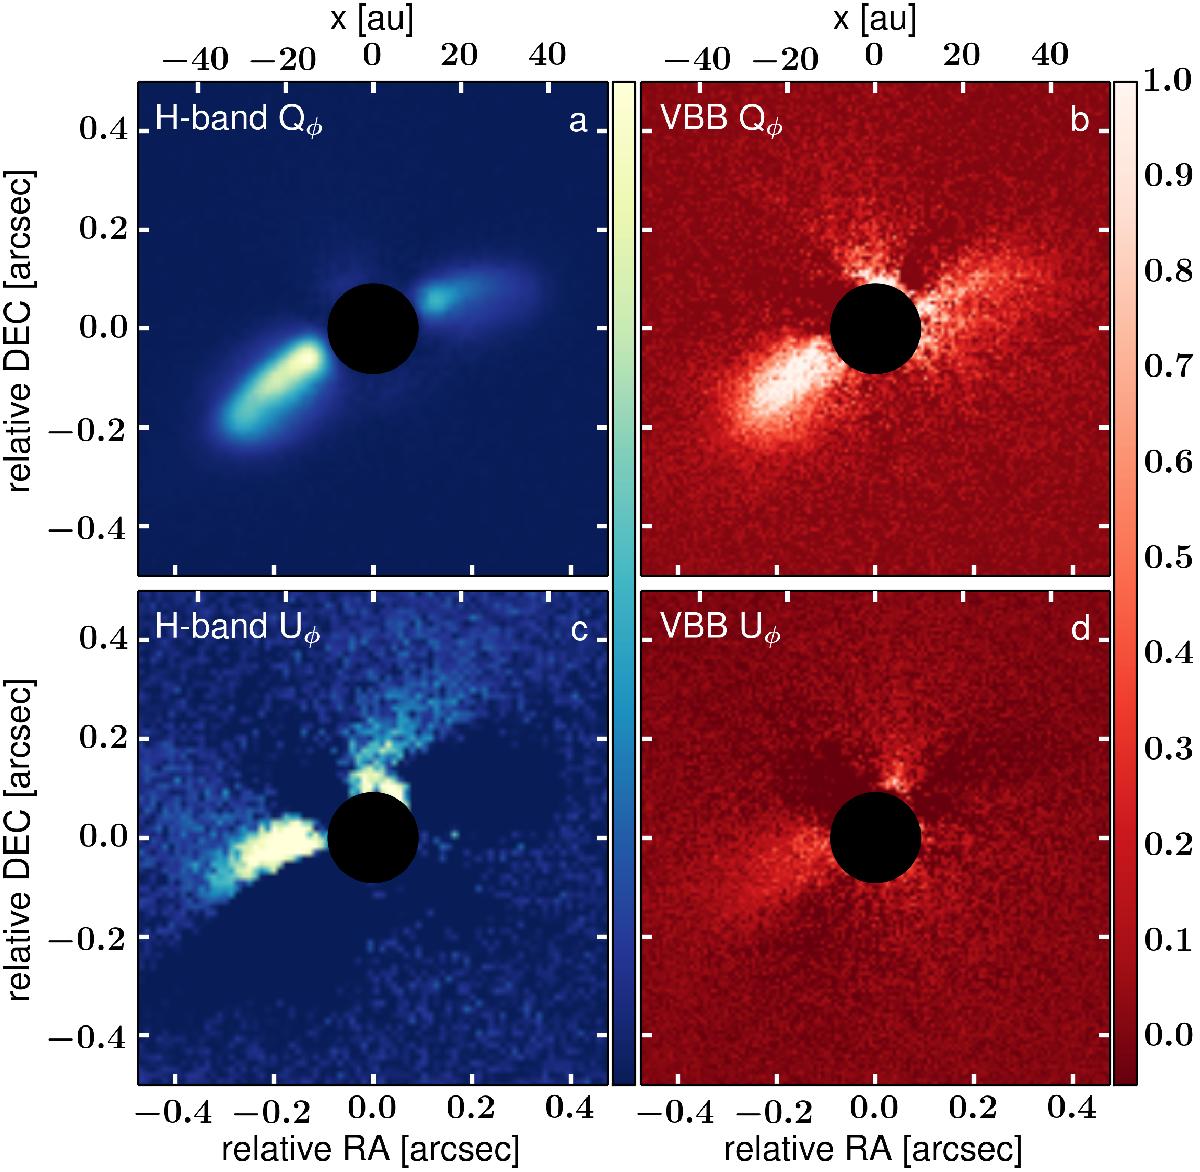
IRDIS-DPI H-band and ZIMPOL P2 VBB-filter Qφ (top row) and Uφ (bottom row) images. North is up, east is left. All images are normalized to the highest disk brightness. The dynamical range for the color scaling is the same for the two images of the top (1000) and bottom row (20), respectively. An apodized Lyot coronagraph with a mask diameter of ~185 mas was used. The inner 0.̋18 are masked, represented by the black circular area. Negative values of Uφ are saturated at dark blue and dark red color, respectively.
Current usage metrics show cumulative count of Article Views (full-text article views including HTML views, PDF and ePub downloads, according to the available data) and Abstracts Views on Vision4Press platform.
Data correspond to usage on the plateform after 2015. The current usage metrics is available 48-96 hours after online publication and is updated daily on week days.
Initial download of the metrics may take a while.