Free Access
Fig. 3
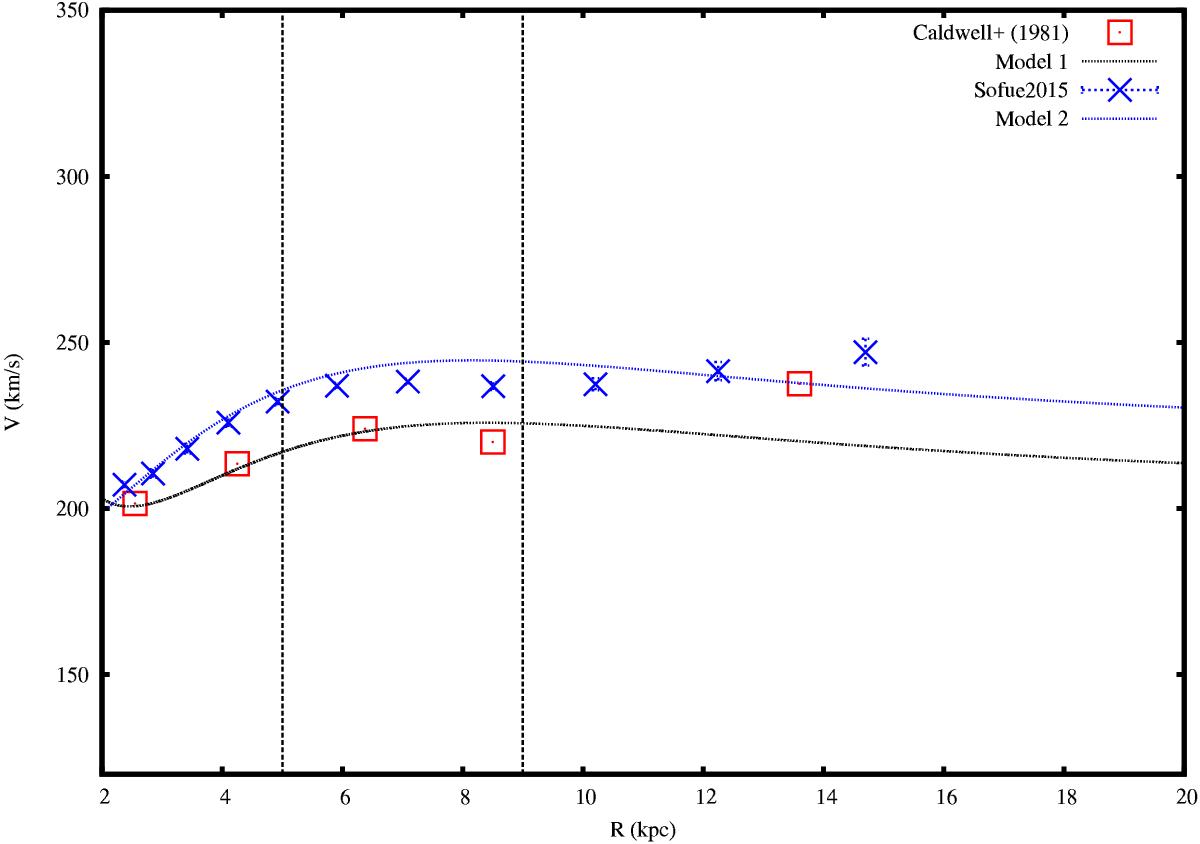
Rotation curve of the mass model, compared with Caldwell & Ostriker (1981) and Sofue (2015). The interval between the two dashed lines indicates the range of Galactocentric distances implied in the present study.
Current usage metrics show cumulative count of Article Views (full-text article views including HTML views, PDF and ePub downloads, according to the available data) and Abstracts Views on Vision4Press platform.
Data correspond to usage on the plateform after 2015. The current usage metrics is available 48-96 hours after online publication and is updated daily on week days.
Initial download of the metrics may take a while.