Free Access
Fig. 1
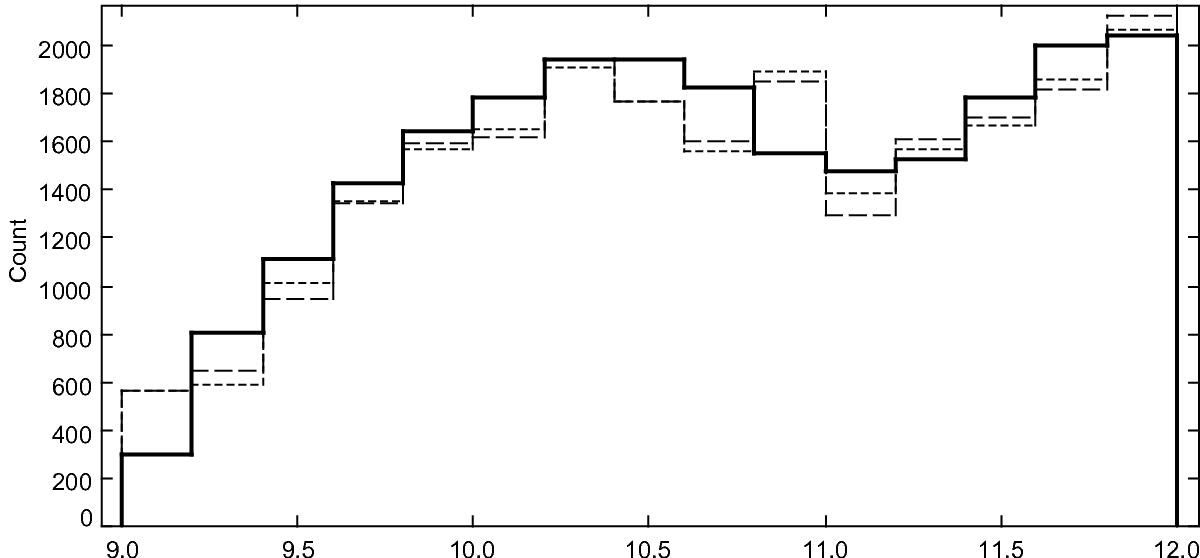
Distribution in I magnitude of the observed sample (solid line) of stars with reliable radial velocities and metallicities, and simulated sample (dashed and dotted line for two independent simulated samples) for the whole RAVE survey.
Current usage metrics show cumulative count of Article Views (full-text article views including HTML views, PDF and ePub downloads, according to the available data) and Abstracts Views on Vision4Press platform.
Data correspond to usage on the plateform after 2015. The current usage metrics is available 48-96 hours after online publication and is updated daily on week days.
Initial download of the metrics may take a while.