Fig. 8
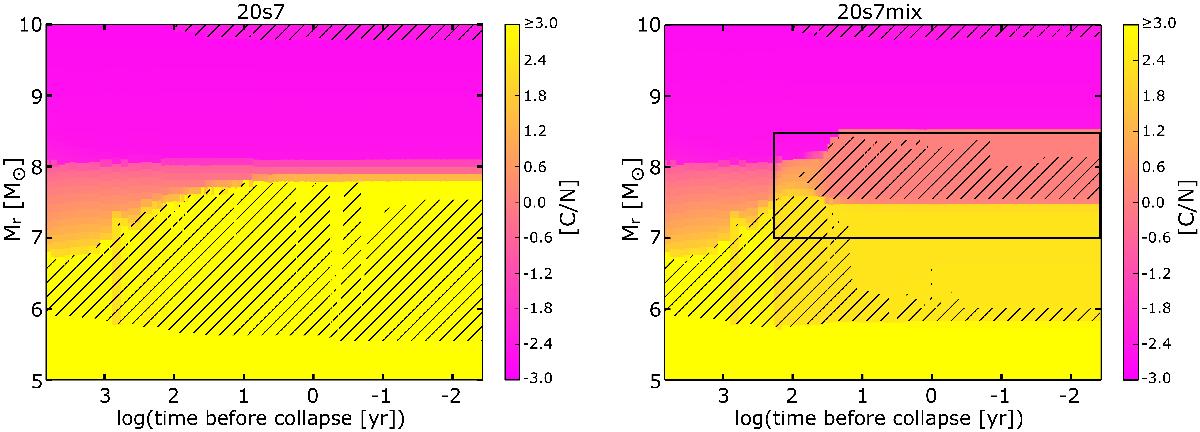
Evolution of the structure as a function of the time left until the core collapse (Kippenhahn diagram) for the 20s7 model without (left) and with (right) late mixing. The colour-scale shows the value of [C/N] inside the star. Hatched areas represent the convective zones. The black frame on the right panel indicates where and when the mixing is enhanced.
Current usage metrics show cumulative count of Article Views (full-text article views including HTML views, PDF and ePub downloads, according to the available data) and Abstracts Views on Vision4Press platform.
Data correspond to usage on the plateform after 2015. The current usage metrics is available 48-96 hours after online publication and is updated daily on week days.
Initial download of the metrics may take a while.