Fig. 3
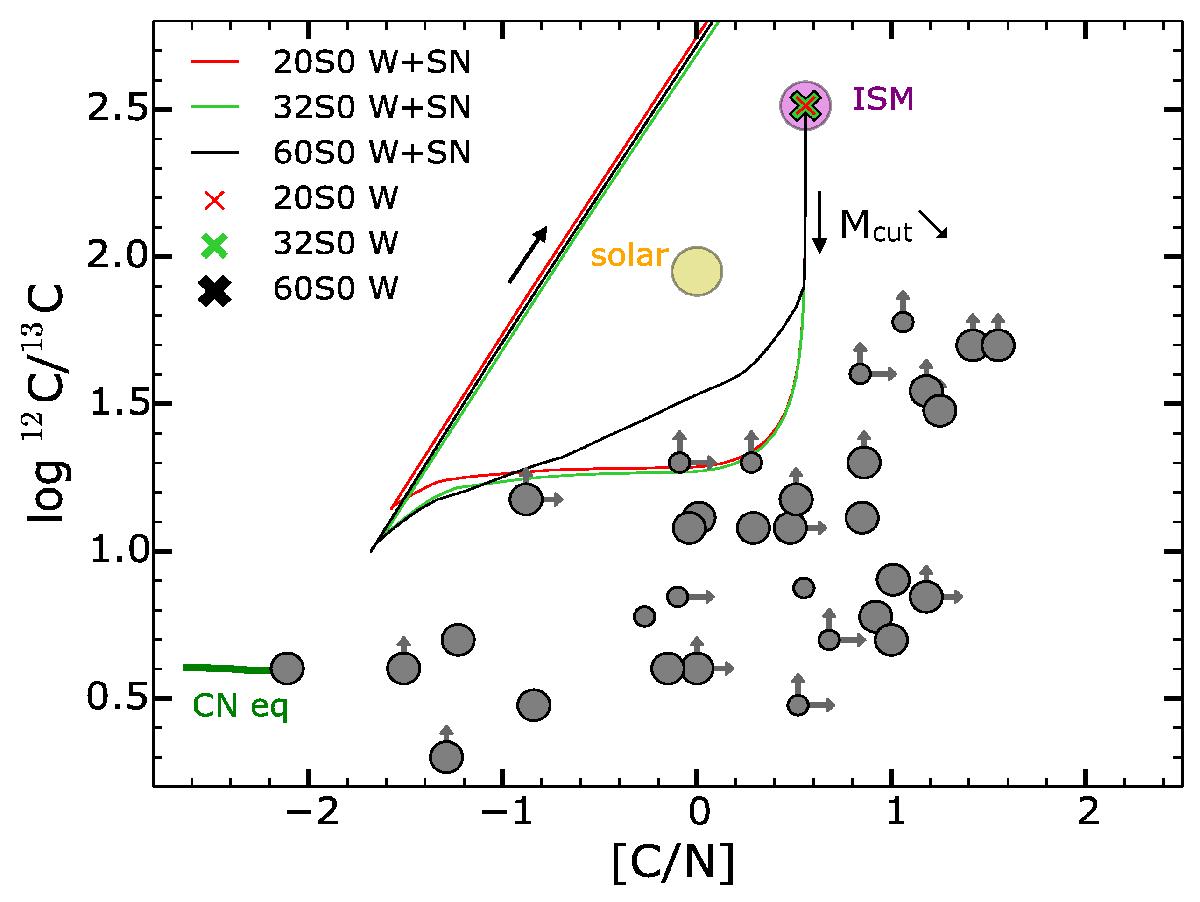
[C/N] vs. log (12C /13C) diagram. Grey circles are ratios observed at the surface of CEMP-no stars with [ Fe / H ] < − 2.5, [ C / Fe ] > 0.7 and [ Ba / Fe ] < 1 (Christlieb et al. 2004; Beers et al. 2007; Johnson et al. 2007; Lai et al. 2008; Masseron et al. 2010; Allen et al. 2012; Norris et al. 2013; Spite et al. 2013; Yong et al. 2013; Cohen et al. 2013; Roederer et al. 2014c; Hansen et al. 2015). Small circles are MS stars or subgiants while large circles are bright giants. The arrows indicate that only lower limits are deduced from spectroscopy. The yellow and purple circles represent the solar ratios and the ratio in an α-enhanced ISM, respectively. The tracks represent the integrated ratios as more and more layers of the final structure are ejected and added to the wind (W+SN, effect of the mass cut, see Eq. (5)) for the 20, 32, and 60 M⊙ non-rotating models. The crosses show the ratios in the wind (W) at the end of silicon-burning (the crosses are superimposed). The thick green lines labelled “CN eq” represent the ratios obtained in a single zone at CN-equilibrium for 30 <T< 80 MK.
Current usage metrics show cumulative count of Article Views (full-text article views including HTML views, PDF and ePub downloads, according to the available data) and Abstracts Views on Vision4Press platform.
Data correspond to usage on the plateform after 2015. The current usage metrics is available 48-96 hours after online publication and is updated daily on week days.
Initial download of the metrics may take a while.