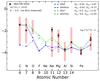
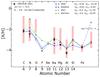
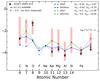
Fig. 11
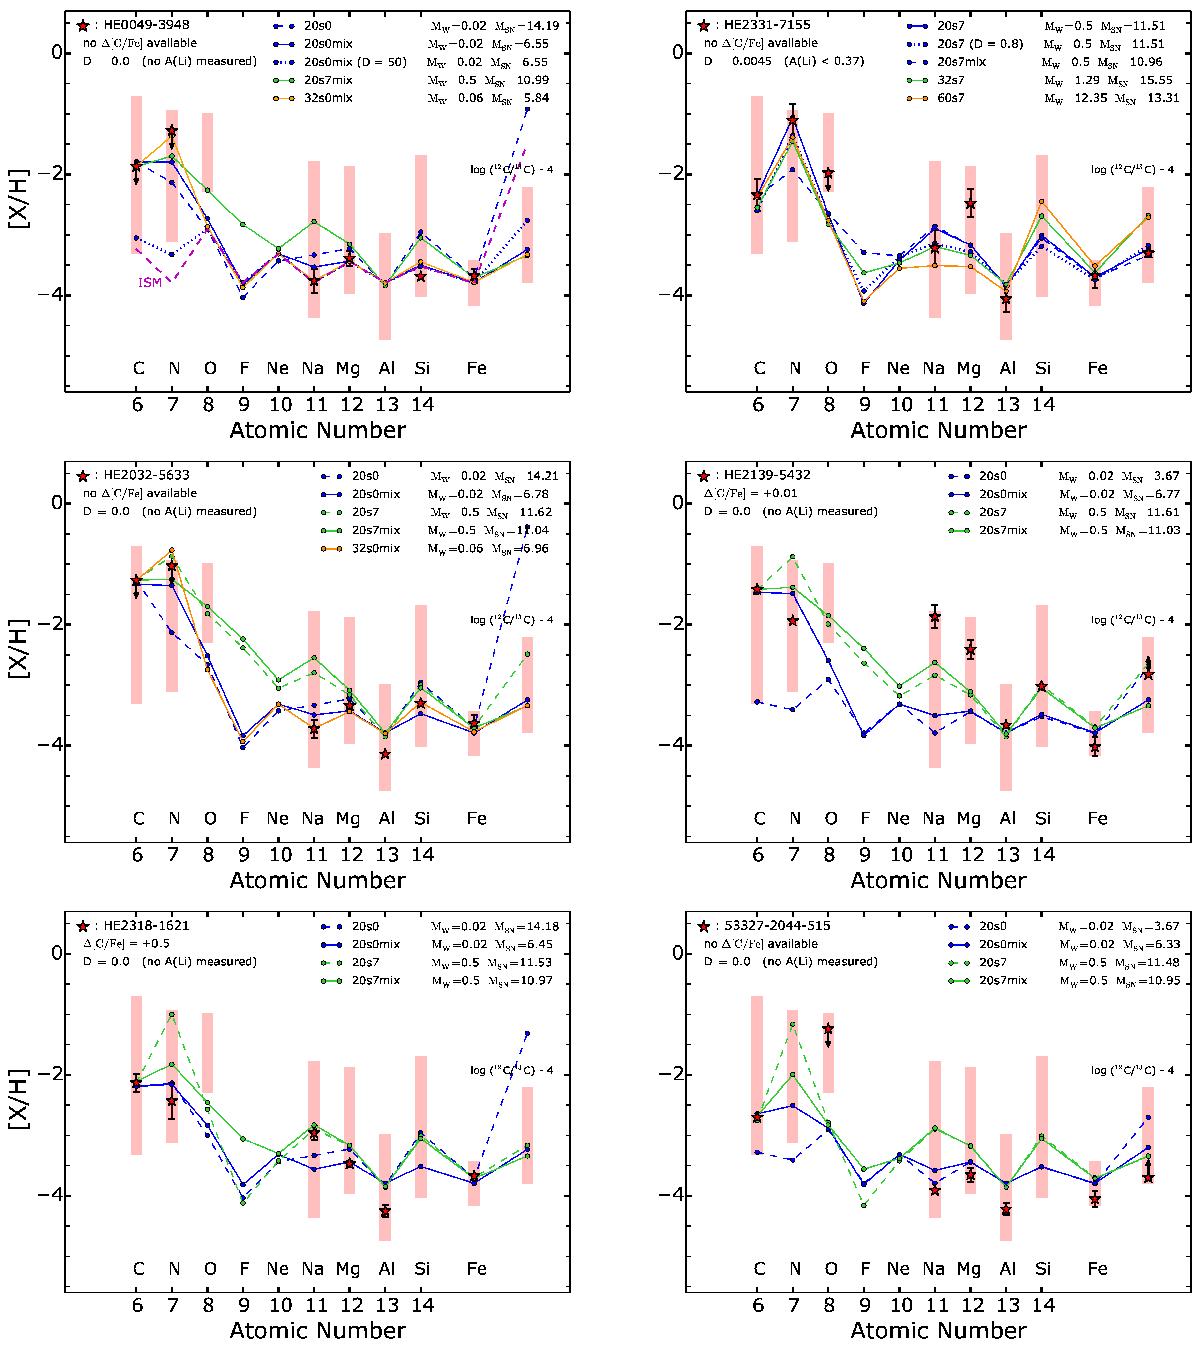
[X/H] as a function of the atomic number. Also log 12C/13C is shown (shifted downwards by 4 dex for clarity). Each panel is dedicated to one observed CEMP-no star (red starry symbols). Arrows indicate upper/lower limits. If available, error bars are indicated. The correction Δ[C/Fe] of Placco et al. (2014b) applied on [C/Fe] (if any) is taken into account and indicated in the upper-left corner. In each panel we show the composition of the ejecta of the indicated models (solid, dashed and dotted lines). The masses ejected by the winds (MW) and the supernova (MSN) are written in the upper-right corner of each panel. The composition of the ISM is shown in the first panel. The dilution coefficient D and A(Li) value (if available) are shown in the upper-left corner. The range of observed [X/H] ratios and log (12C /13C) ratios for the stars in Table 2 are shown by the red rectangles.
Current usage metrics show cumulative count of Article Views (full-text article views including HTML views, PDF and ePub downloads, according to the available data) and Abstracts Views on Vision4Press platform.
Data correspond to usage on the plateform after 2015. The current usage metrics is available 48-96 hours after online publication and is updated daily on week days.
Initial download of the metrics may take a while.