Fig. 8
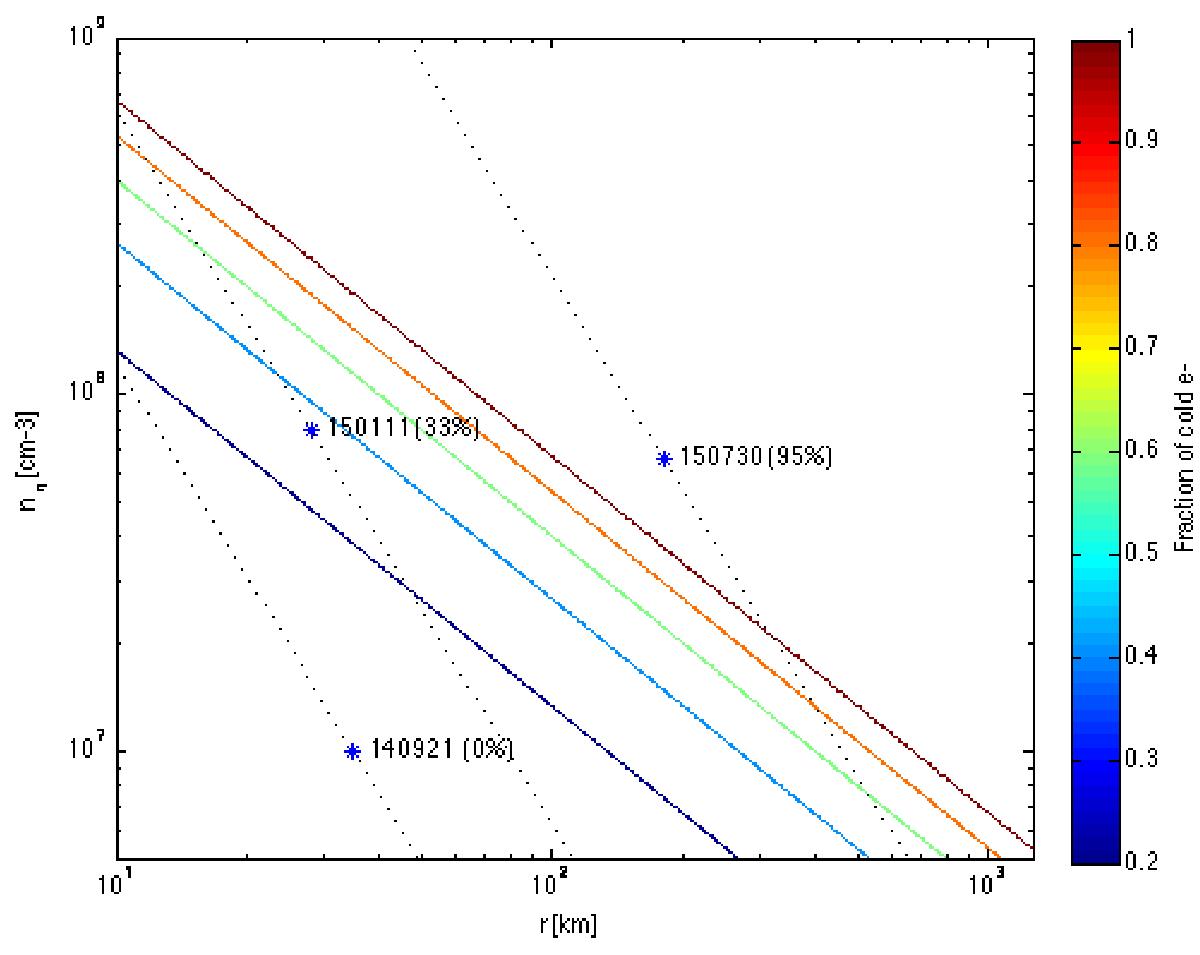
Expected fraction of cold electron gas as a function of radial distance and neutral density – contour plots for 20% (marine), 40% (blue), 60% (green), 80% (orange), and 100% (brown). The black dotted lines show 1 /r2 neutral density profiles for the COPS values observed at the points marked with stars on the dates shown. The fraction of cold electrons in the sweep fits in Table 1 is indicated in parenthesis.
Current usage metrics show cumulative count of Article Views (full-text article views including HTML views, PDF and ePub downloads, according to the available data) and Abstracts Views on Vision4Press platform.
Data correspond to usage on the plateform after 2015. The current usage metrics is available 48-96 hours after online publication and is updated daily on week days.
Initial download of the metrics may take a while.