Fig. 7
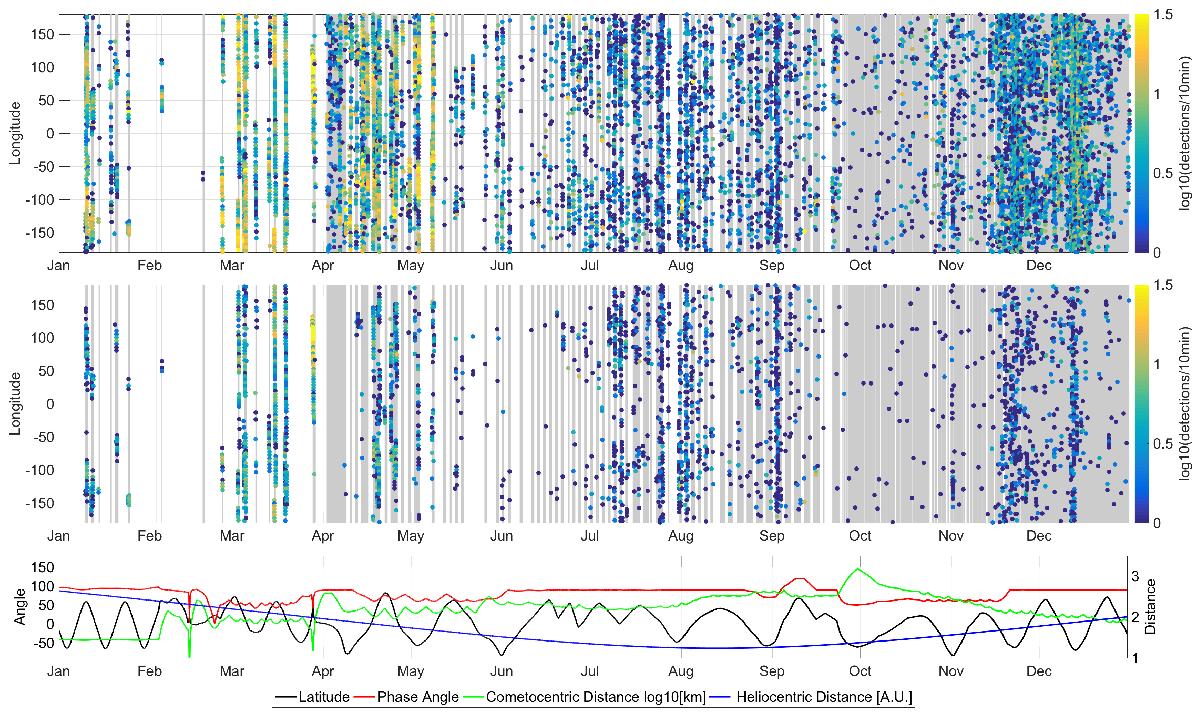
Distribution in time and space of current pulses in LAP, based on the simple algorithm described in the text. Grey indicates regions searched where no pulses were detected by the algorithm; white periods indicate regions without suitable data. Top: number of pulses detected in LAP1 probe current per 10-min period, corresponding to 5° cometary longitude, during 2015. Centre: number of large pulses per 10-min period. Below: latitude and phase angle (solar zenith angle) on left scale, heliocentric distance in AU and 10log of cometocentric distance in km on right scale.
Current usage metrics show cumulative count of Article Views (full-text article views including HTML views, PDF and ePub downloads, according to the available data) and Abstracts Views on Vision4Press platform.
Data correspond to usage on the plateform after 2015. The current usage metrics is available 48-96 hours after online publication and is updated daily on week days.
Initial download of the metrics may take a while.