Fig. 5
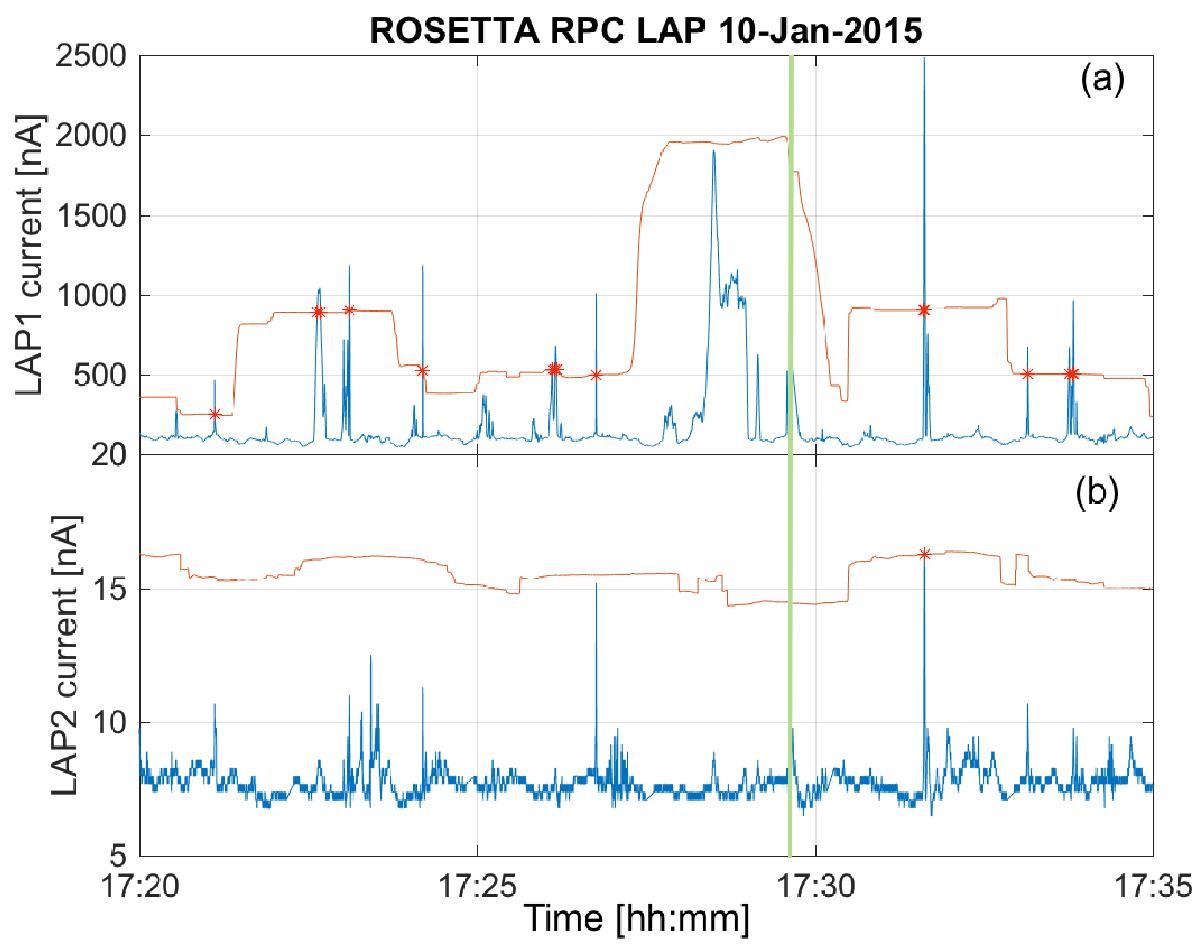
Zoom in two parts of the interval in Fig. 4 to show details of pulses. The current here is sampled at 57.8 Hz, but very little structure is to be seen at timescales shorter than about a second. Blue is measured current and red is the dynamic threshold for pulse detection defined in the text. The vertical green line indicates the time of the sweep in Fig. 6.
Current usage metrics show cumulative count of Article Views (full-text article views including HTML views, PDF and ePub downloads, according to the available data) and Abstracts Views on Vision4Press platform.
Data correspond to usage on the plateform after 2015. The current usage metrics is available 48-96 hours after online publication and is updated daily on week days.
Initial download of the metrics may take a while.