Fig. 4
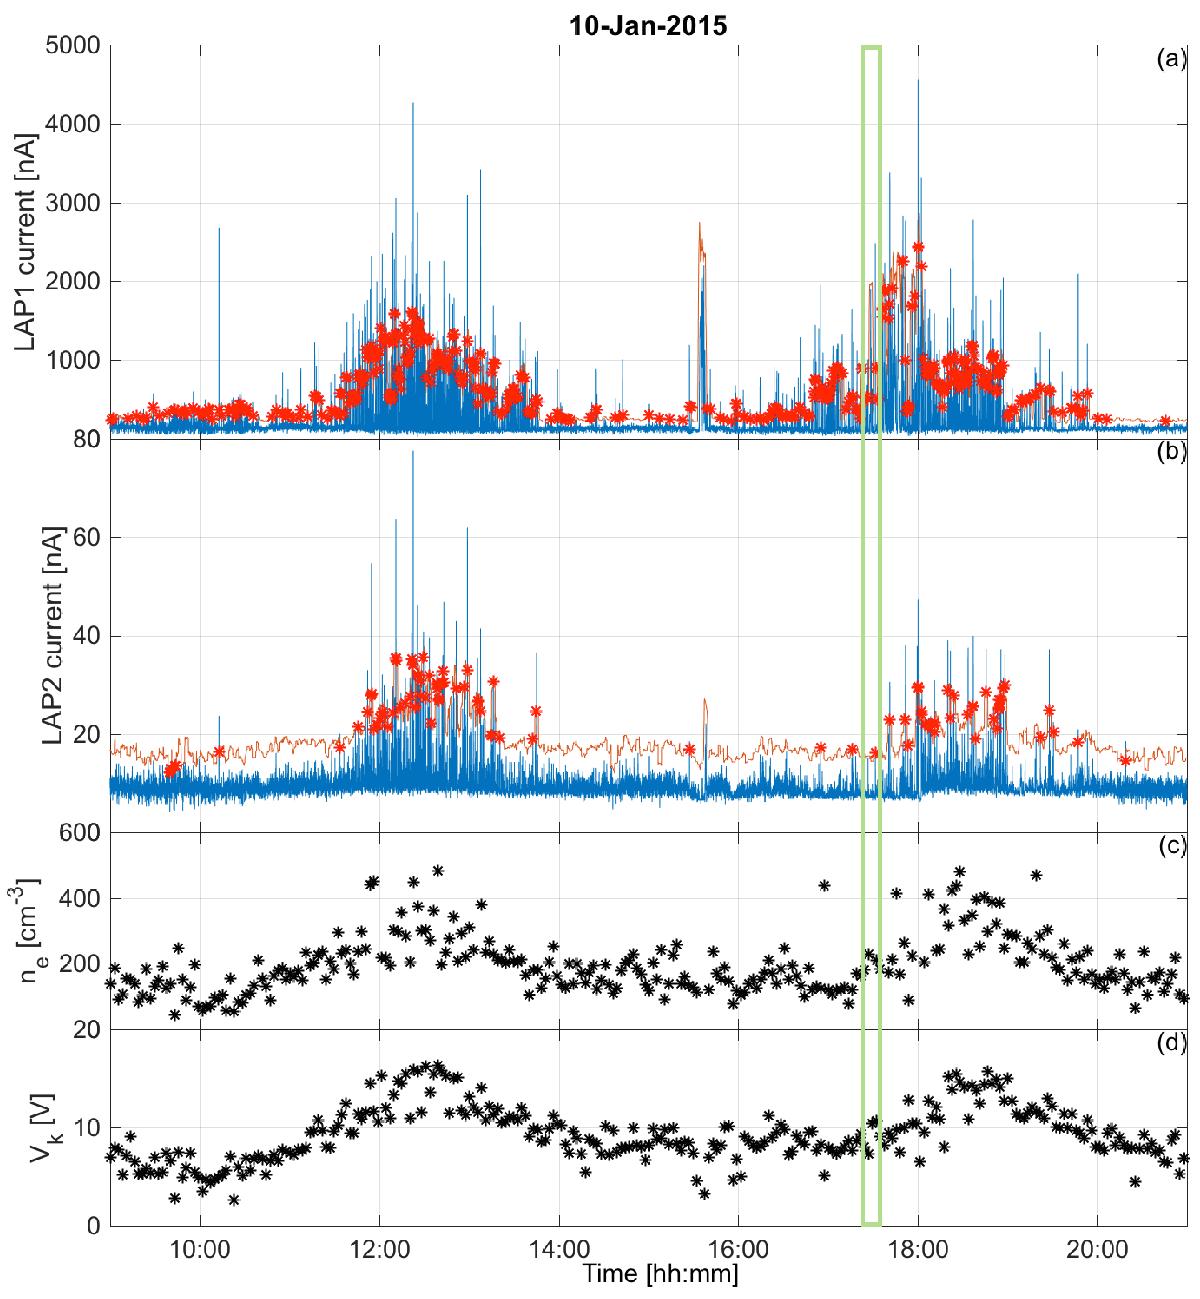
Example of pulses in LAP1 (at +30 V, panel a) and LAP2 (at –30 V, panel b) current (blue). In red is shown the dynamic threshold used to define pulses, with red dots marking the pulses found by the algorithm. Panels c and d show sweep fit results for electron density and the negative of the spacecraft potential. The sign of the LAP2 current has been inverted, to show density increases as positive. The green box marks the interval zoomed into in Fig. 5.
Current usage metrics show cumulative count of Article Views (full-text article views including HTML views, PDF and ePub downloads, according to the available data) and Abstracts Views on Vision4Press platform.
Data correspond to usage on the plateform after 2015. The current usage metrics is available 48-96 hours after online publication and is updated daily on week days.
Initial download of the metrics may take a while.