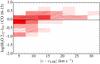
Fig. 8
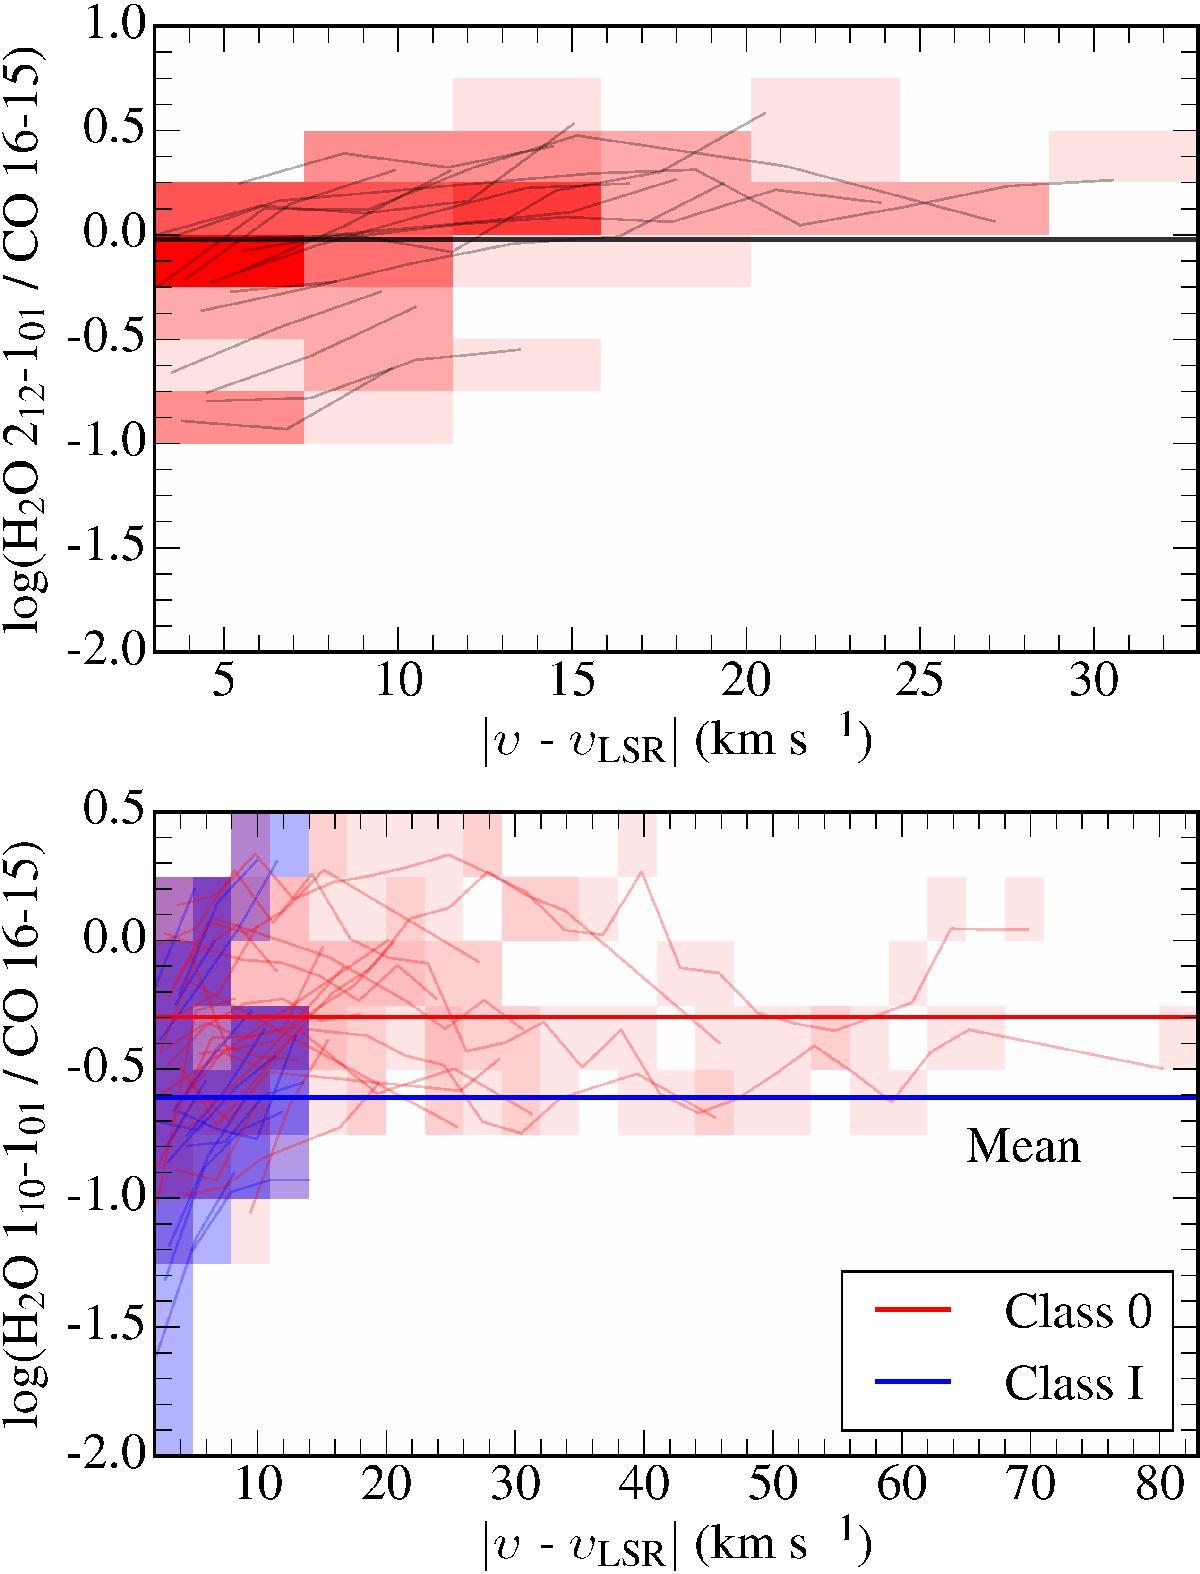
Top: H2O 212–101/CO 16–15 line ratio as a function of velocity toward the six Class 0 sources where the H2O line is observed with HIFI. The brightness of the color indicates the number of observations passing through a given poin – brighter represents a higher number. The channel size is 3 km s-1. Bottom: same as top but for the H2O 110–101/CO 16–15 line ratio where Class 0 and I sources are separated (red and blue, respectively). The total mean ratio is displayed.
Current usage metrics show cumulative count of Article Views (full-text article views including HTML views, PDF and ePub downloads, according to the available data) and Abstracts Views on Vision4Press platform.
Data correspond to usage on the plateform after 2015. The current usage metrics is available 48-96 hours after online publication and is updated daily on week days.
Initial download of the metrics may take a while.