Fig. 7
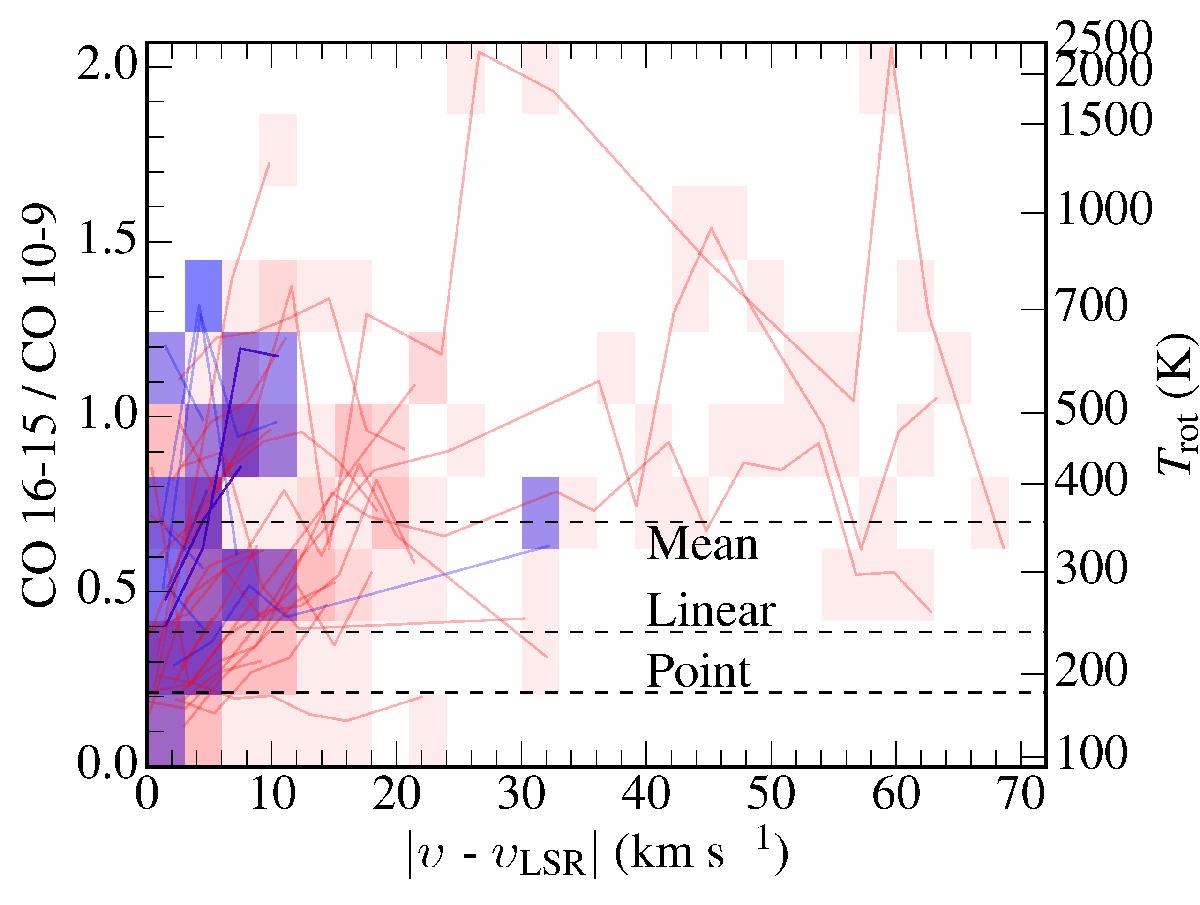
CO 16–15/10–9 line ratio for all 19 sources for which both data sets are available. The spectra have been rebinned to 3 km s-1 channels and only data points with S/N> 2 are included. The brightness of the color indicates the number of observations passing through a given point – brighter represents a higher number. Line ratios around ±2 km s-1 are not included. Red is for Class 0 line wings, and blue for Class I. The mean ratio is displayed with a dashed line; if a linear scaling to correct for different beam sizes is applied the mean value shifts down to the dashed line marked “linear”, and similarly for a point-source scaling. The rotational temperature corresponding to a particular line ratio is shown on the second axis.
Current usage metrics show cumulative count of Article Views (full-text article views including HTML views, PDF and ePub downloads, according to the available data) and Abstracts Views on Vision4Press platform.
Data correspond to usage on the plateform after 2015. The current usage metrics is available 48-96 hours after online publication and is updated daily on week days.
Initial download of the metrics may take a while.