Fig. 6
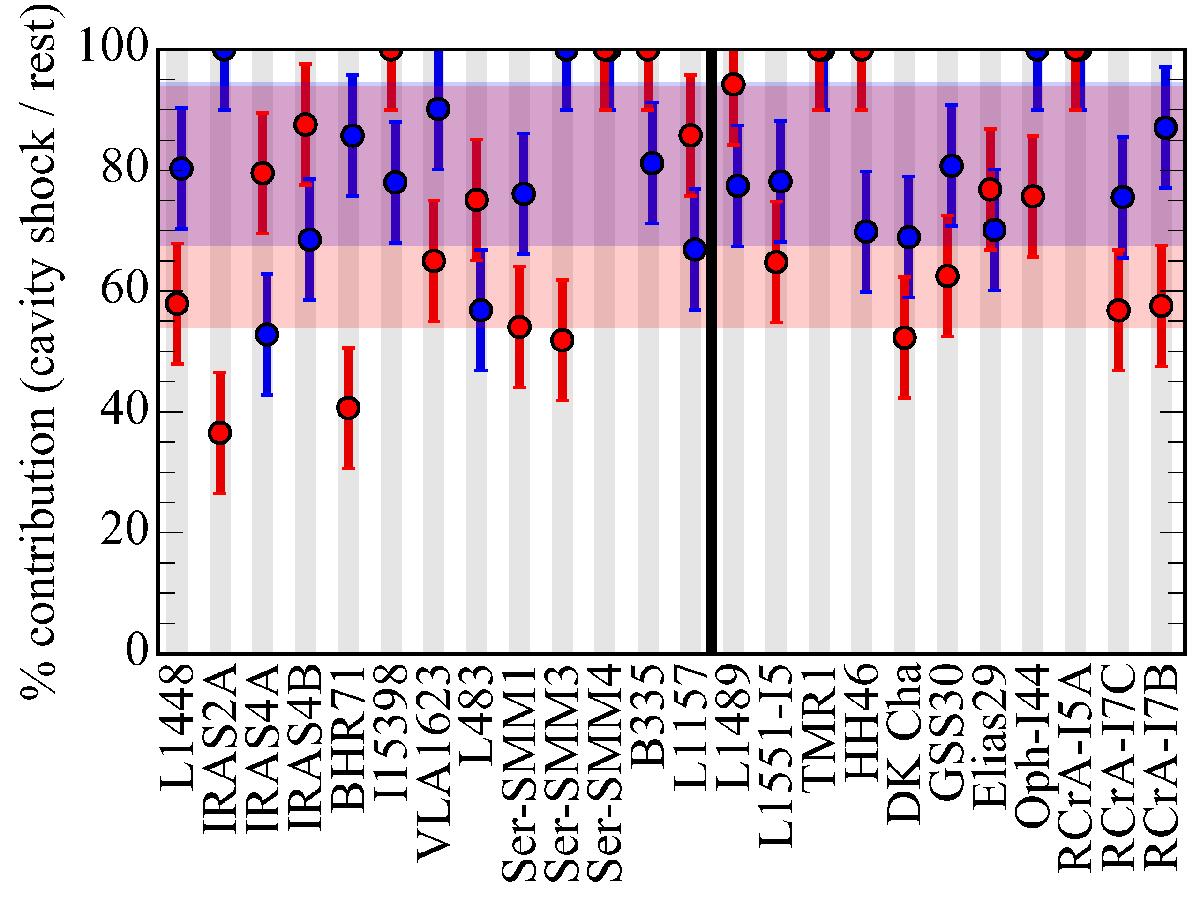
Fraction of the contribution to the total integrated CO 16–15 line intensity from the broad cavity shock component as measured from HIFI data (red). The vertical thick black line marks the division between Class 0 and I sources, where the former is to the left, the latter to the right. The blue points show the fraction of CO 16–15 emission expected to originate in the PACS warm 300 K component (Karska et al., in prep.). Both the HIFI and PACS fractions have ~10% uncertainties associated with them. The shaded red and blue regions show the spread of fractions for the HIFI and PACS components, respectively, and where there is an overlap the color is purple. Within the error bars, the fractions are the same, and the broad cavity shock component dominates emission.
Current usage metrics show cumulative count of Article Views (full-text article views including HTML views, PDF and ePub downloads, according to the available data) and Abstracts Views on Vision4Press platform.
Data correspond to usage on the plateform after 2015. The current usage metrics is available 48-96 hours after online publication and is updated daily on week days.
Initial download of the metrics may take a while.