Free Access
Fig. 2
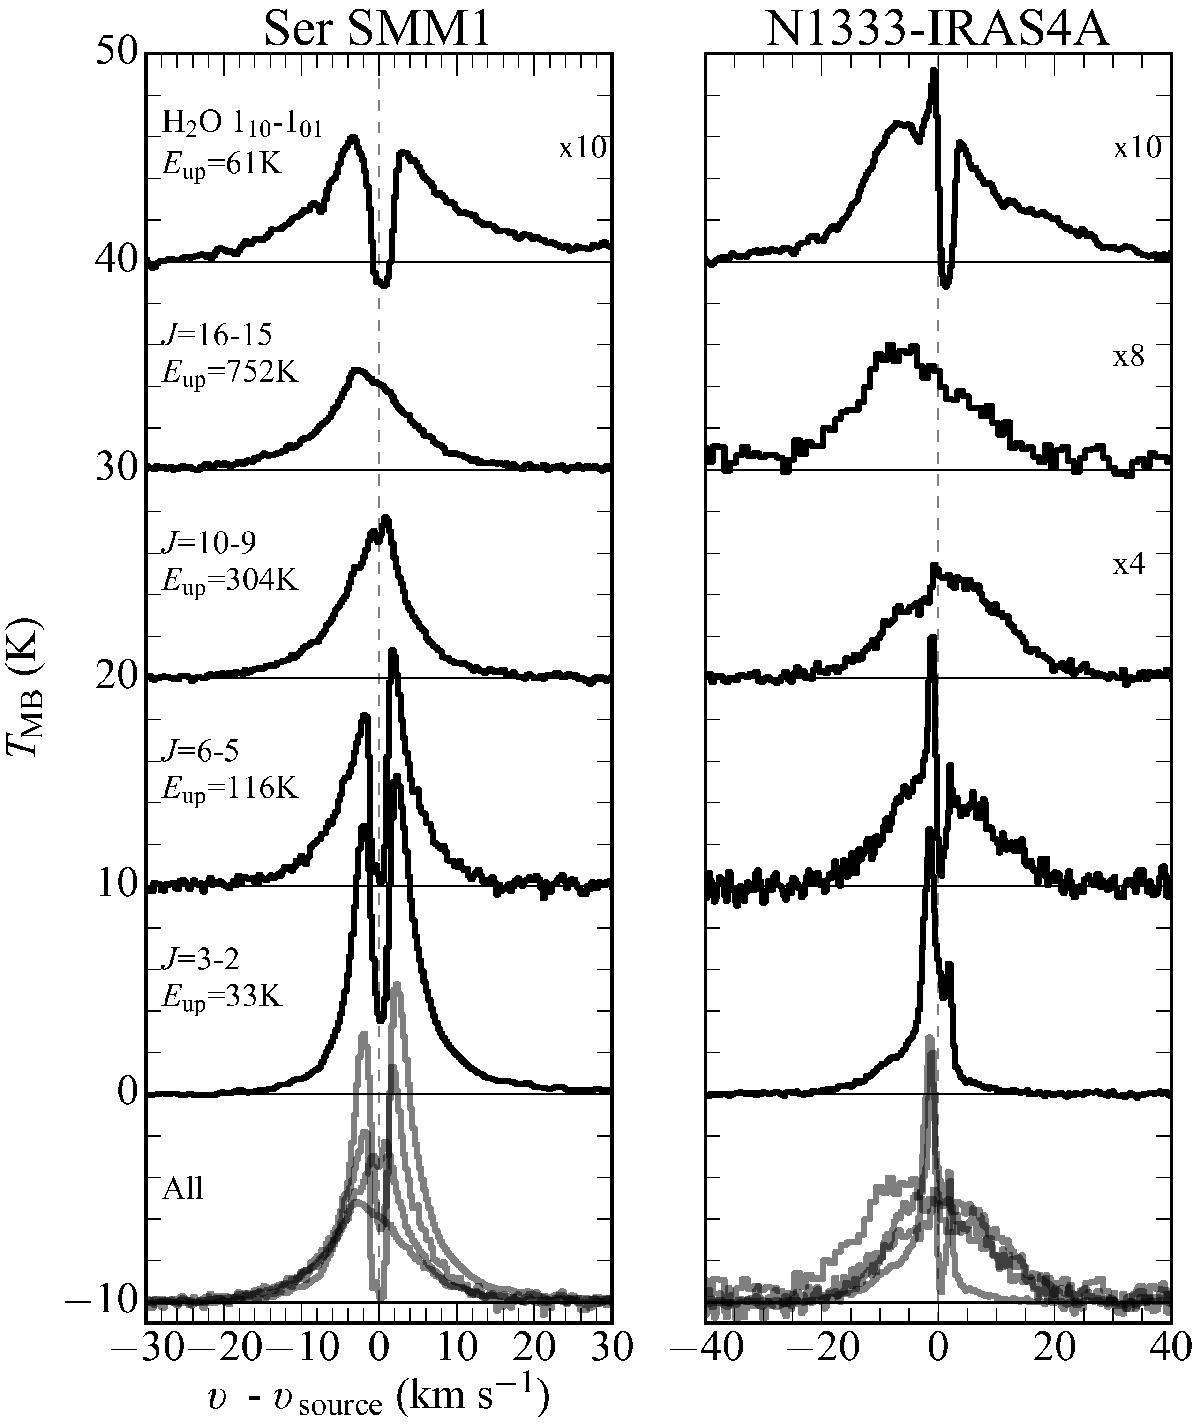
CO and H2O spectra toward Ser SMM1 and NGC1333 IRAS4A. No correction has been made for the differences in beam size of the observation. Spectra have been shifted to a velocity of 0 km s-1. The bottom panel shows all CO profiles overlaid on top of one another.
Current usage metrics show cumulative count of Article Views (full-text article views including HTML views, PDF and ePub downloads, according to the available data) and Abstracts Views on Vision4Press platform.
Data correspond to usage on the plateform after 2015. The current usage metrics is available 48-96 hours after online publication and is updated daily on week days.
Initial download of the metrics may take a while.