Fig. A.4
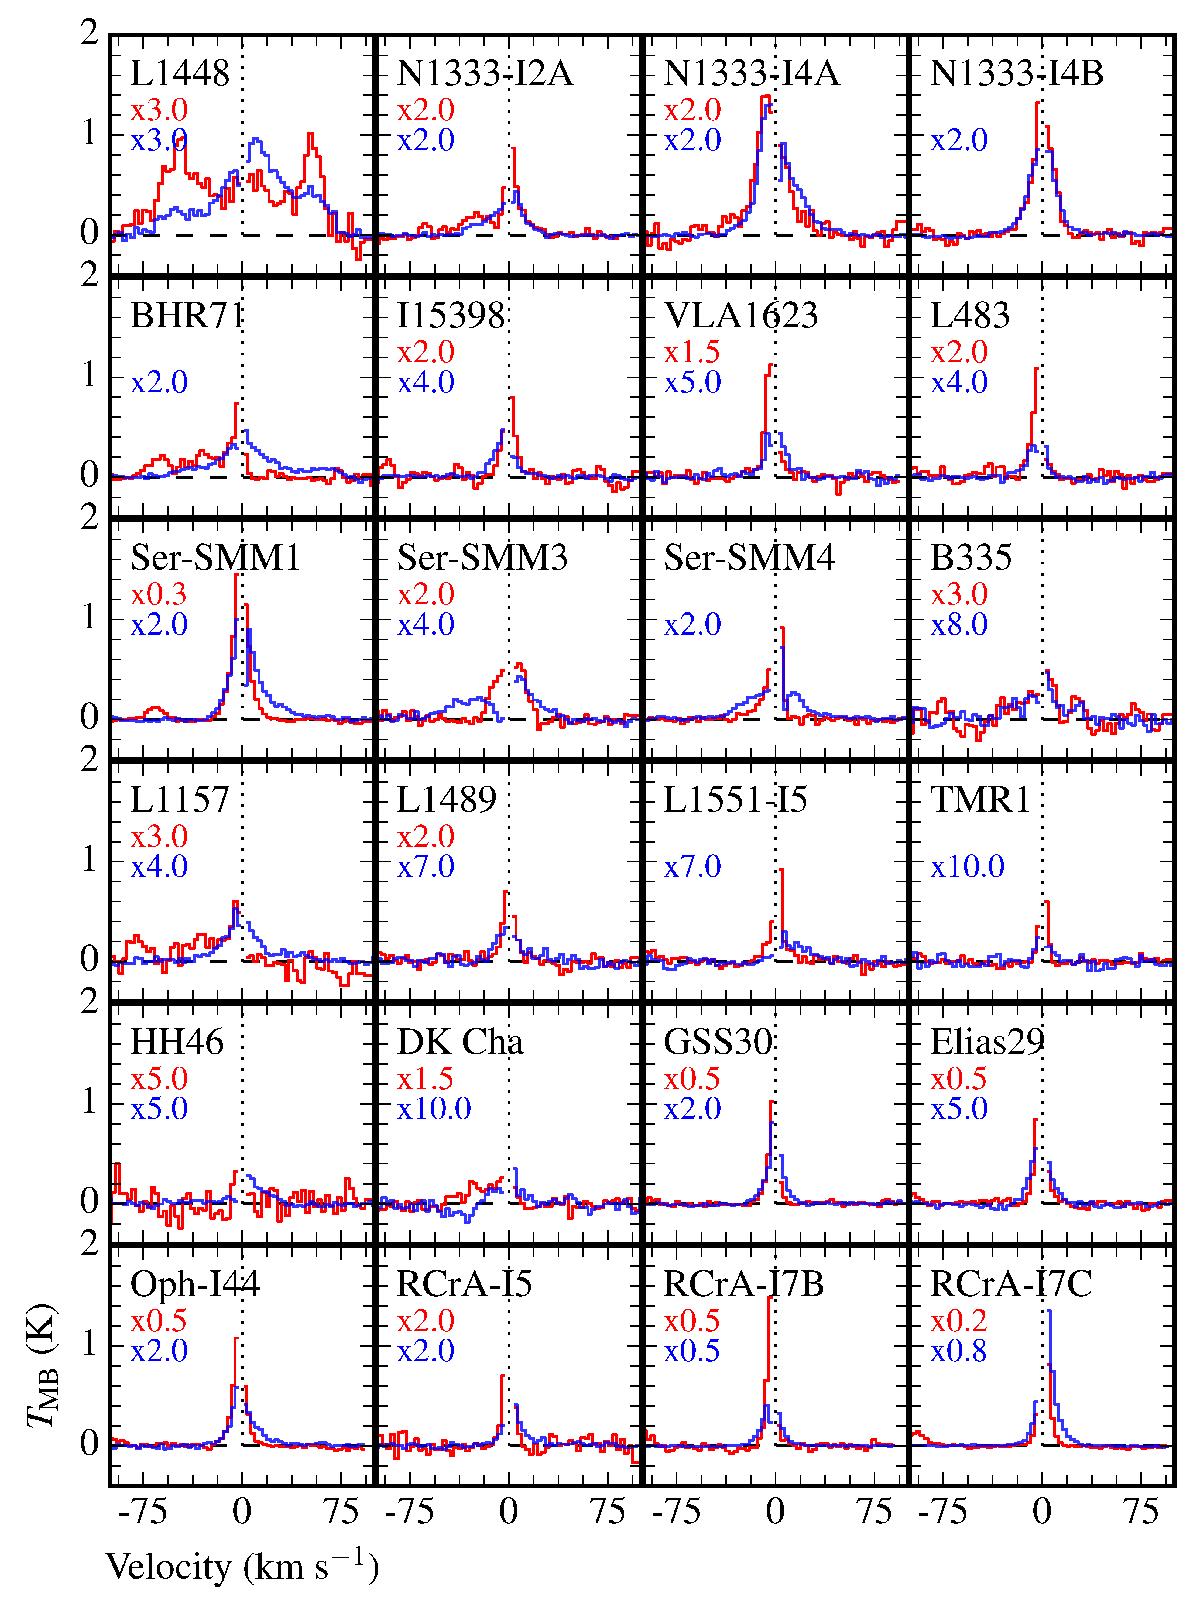
H2O 110–101 (blue) and CO 16–15 (red) line profiles for all sources shown individually. The spectra have been rebinned to 3 km s-1 channels. The central 2 km s-1 have been masked out because of self-absorption in the H2O line, and are not shown. The vertical dotted line is for 0 km s-1 and the horizontal dashed line is the baseline. Both the H2O and CO spectra have been scaled for clarity, with the scaling factor shown in each plot.
Current usage metrics show cumulative count of Article Views (full-text article views including HTML views, PDF and ePub downloads, according to the available data) and Abstracts Views on Vision4Press platform.
Data correspond to usage on the plateform after 2015. The current usage metrics is available 48-96 hours after online publication and is updated daily on week days.
Initial download of the metrics may take a while.