Fig. A.1
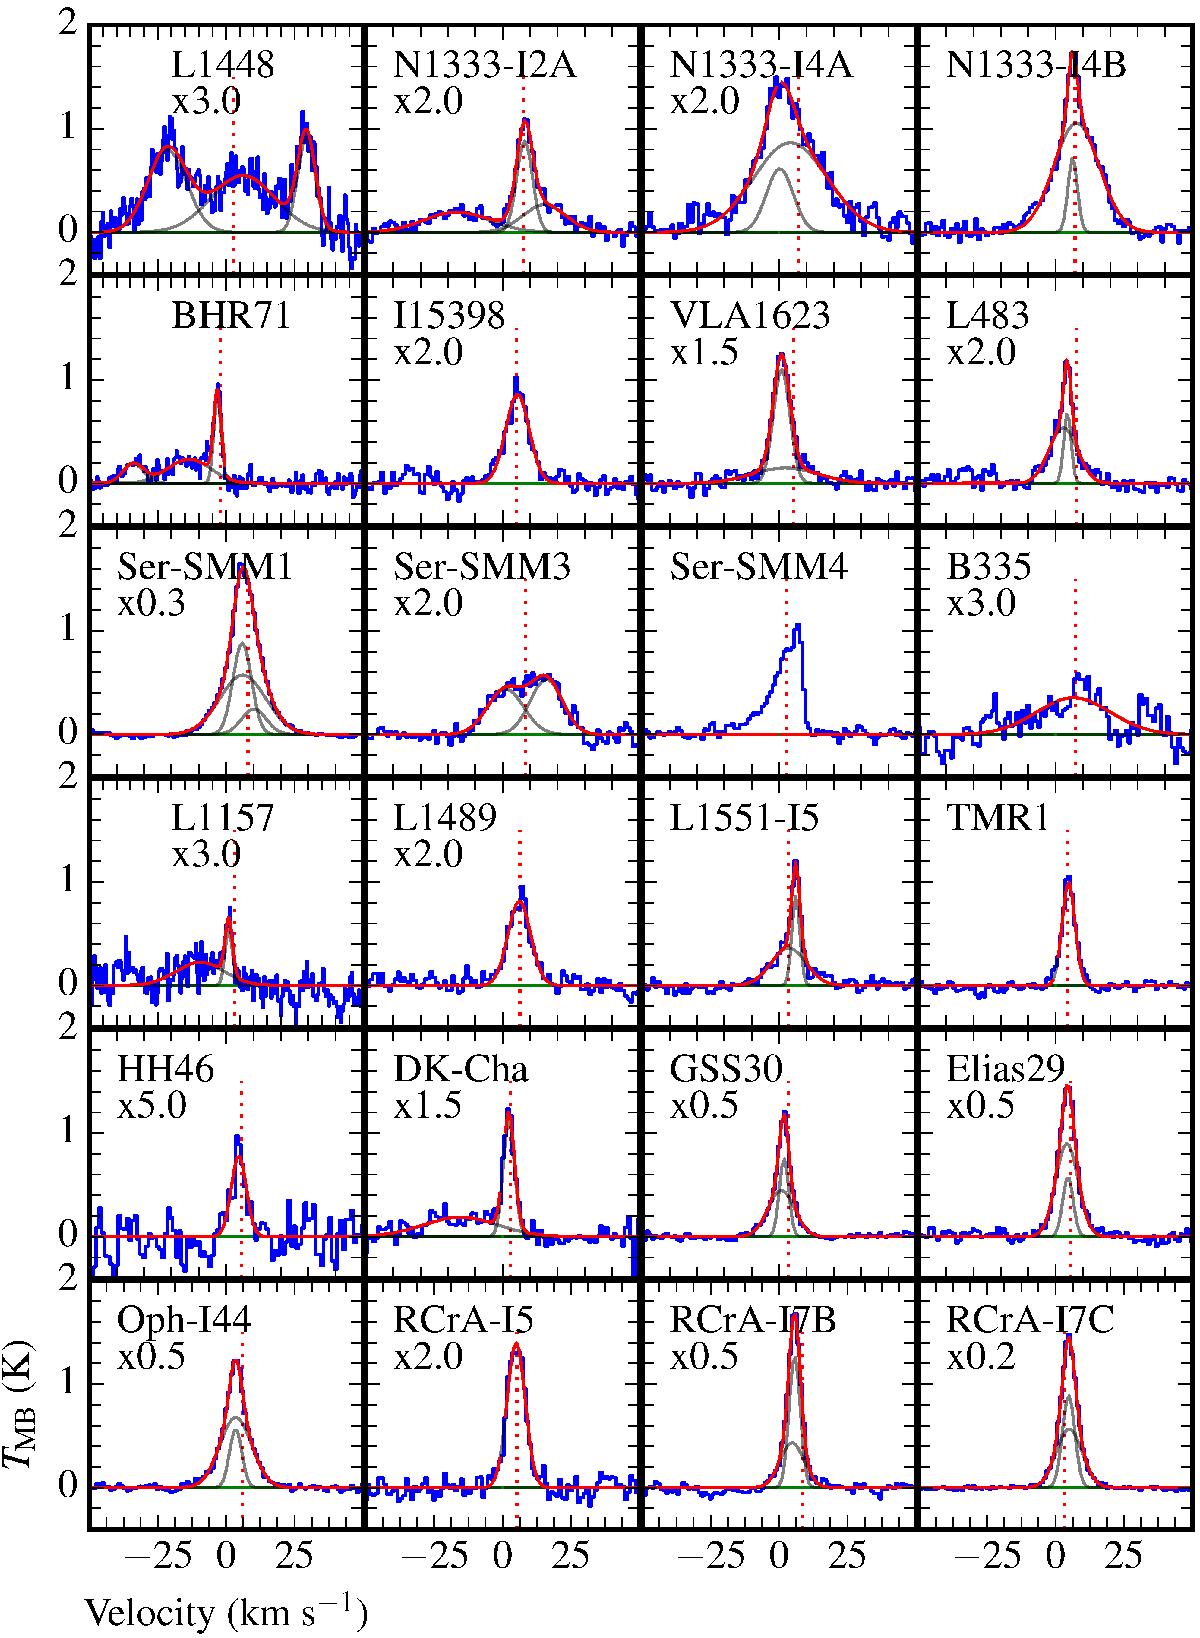
CO 16–15 spectra toward all observed sources. The source velocity is marked with a red dashed line in each panel and the baseline is shown in green. The best-fit Gaussian decomposition is overlaid in red, with individual Gaussian components shown in gray. The velocity scale in the L1448, BHR71, and L1157 spectra is from –100 to +100 km s-1. Ser-SMM4 is not decomposed into Gaussian functions because it appears entirely triangular.
Current usage metrics show cumulative count of Article Views (full-text article views including HTML views, PDF and ePub downloads, according to the available data) and Abstracts Views on Vision4Press platform.
Data correspond to usage on the plateform after 2015. The current usage metrics is available 48-96 hours after online publication and is updated daily on week days.
Initial download of the metrics may take a while.