Fig. 11
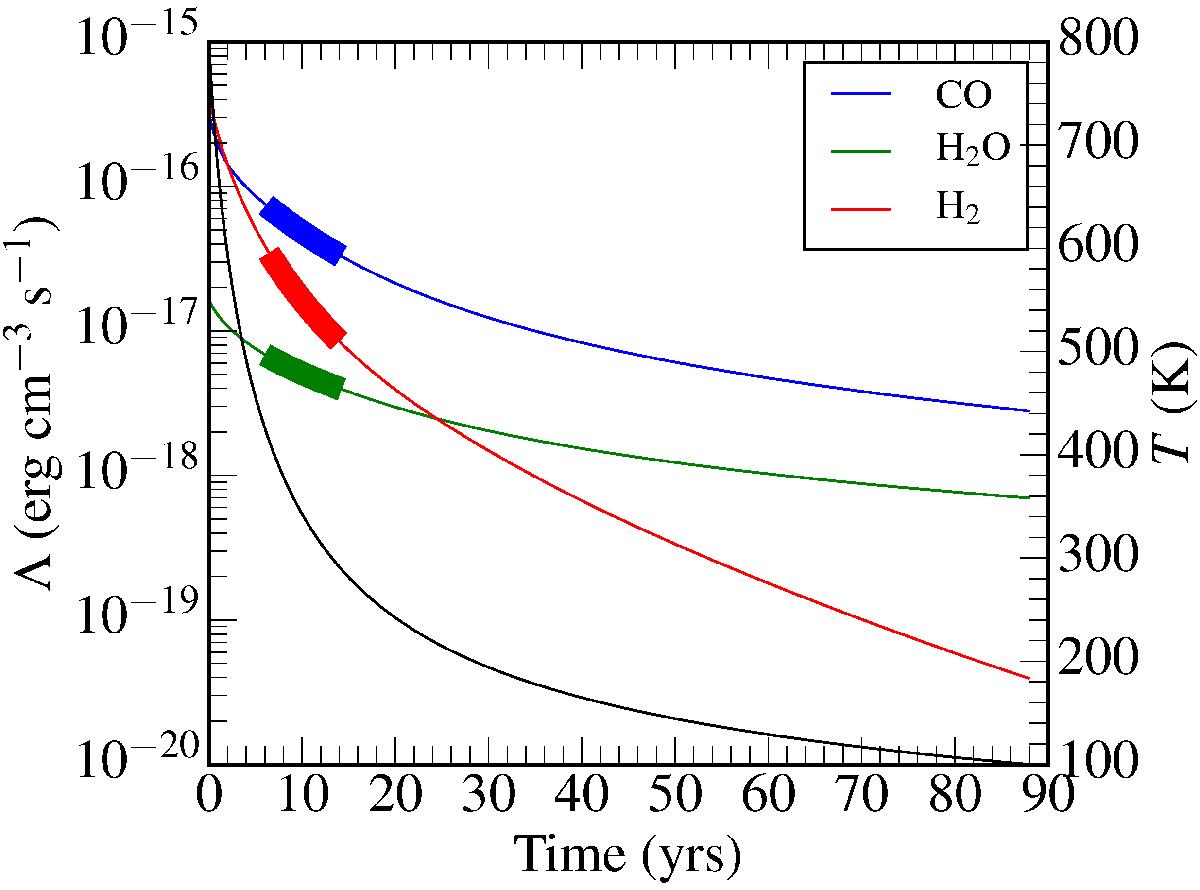
Cooling curves for H2, CO, and H2O using the analytical cooling functions of Neufeld & Kaufman (1993). The colored lines are the cooling rates, and their values are shown on the left axis. The black line is for temperature (right axis). The highlighted parts on the cooling curves are for the temperature range 300–400 K. The H2 density and column densities are as shown in Fig. 9.
Current usage metrics show cumulative count of Article Views (full-text article views including HTML views, PDF and ePub downloads, according to the available data) and Abstracts Views on Vision4Press platform.
Data correspond to usage on the plateform after 2015. The current usage metrics is available 48-96 hours after online publication and is updated daily on week days.
Initial download of the metrics may take a while.