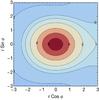
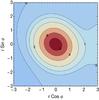
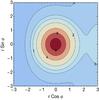
Fig. 3
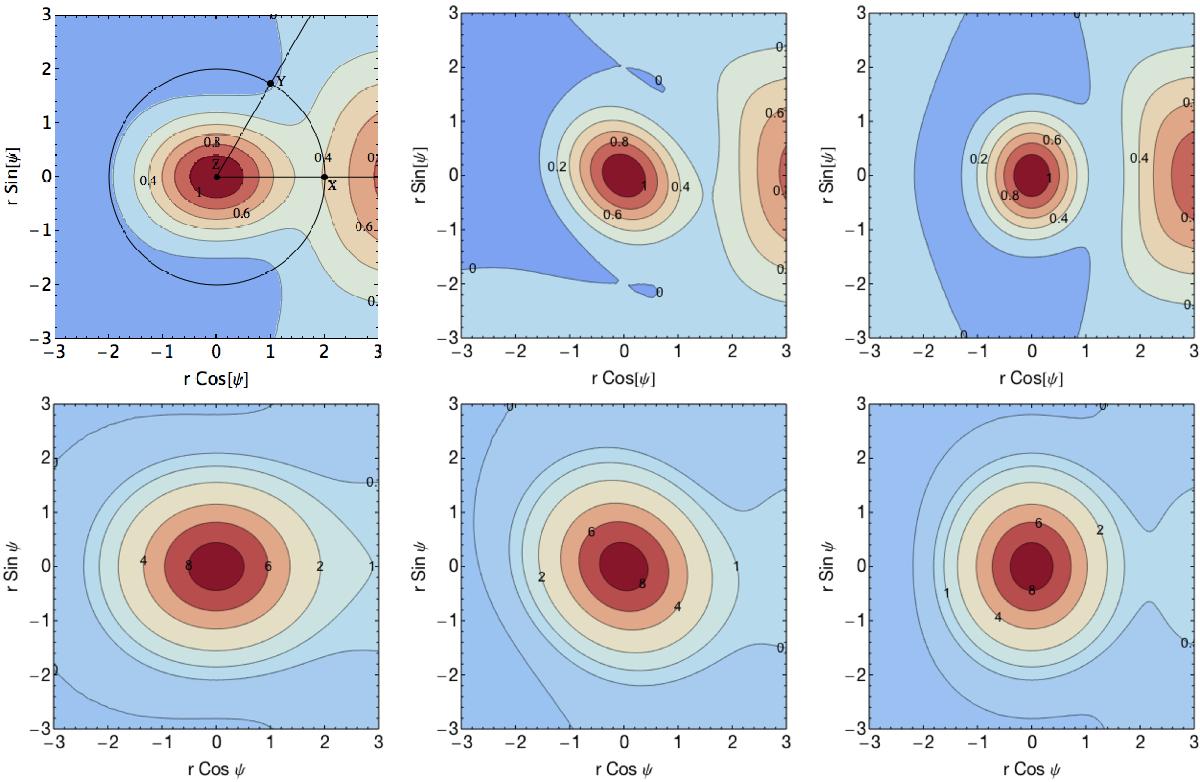
Top panels: expected two-point correlation function ⟨κκ′ | pk⟩ in units of ![]() for a 2D power spectrum with spectral index ns = 0 and a central peak of height
for a 2D power spectrum with spectral index ns = 0 and a central peak of height ![]() and eigenvalues
and eigenvalues ![]() and
and ![]() in rz. Different values of θ, the angle between the major axis of the ellipse (i.e. smaller curvature) and the first point on the annulus between 0 and π/ 2 are shown from left to right. ψ is the angle between rx and ry and r is the separation to the central peak (in units of the smoothing length) so that the shown value corresponds to the correlation function between this point, ry and that on the positive x-axis at the same radius, rx. The values we chose here correspond to the most likely height and curvatures of a peak (and do not depend on the spectral index). Bottom panels: same as top panels for νr = 3. The corresponding most likely curvatures of the peak are λ1r = − 0.94 and λ2r = − 1.6.
in rz. Different values of θ, the angle between the major axis of the ellipse (i.e. smaller curvature) and the first point on the annulus between 0 and π/ 2 are shown from left to right. ψ is the angle between rx and ry and r is the separation to the central peak (in units of the smoothing length) so that the shown value corresponds to the correlation function between this point, ry and that on the positive x-axis at the same radius, rx. The values we chose here correspond to the most likely height and curvatures of a peak (and do not depend on the spectral index). Bottom panels: same as top panels for νr = 3. The corresponding most likely curvatures of the peak are λ1r = − 0.94 and λ2r = − 1.6.
Current usage metrics show cumulative count of Article Views (full-text article views including HTML views, PDF and ePub downloads, according to the available data) and Abstracts Views on Vision4Press platform.
Data correspond to usage on the plateform after 2015. The current usage metrics is available 48-96 hours after online publication and is updated daily on week days.
Initial download of the metrics may take a while.