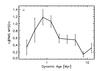
Fig. 10
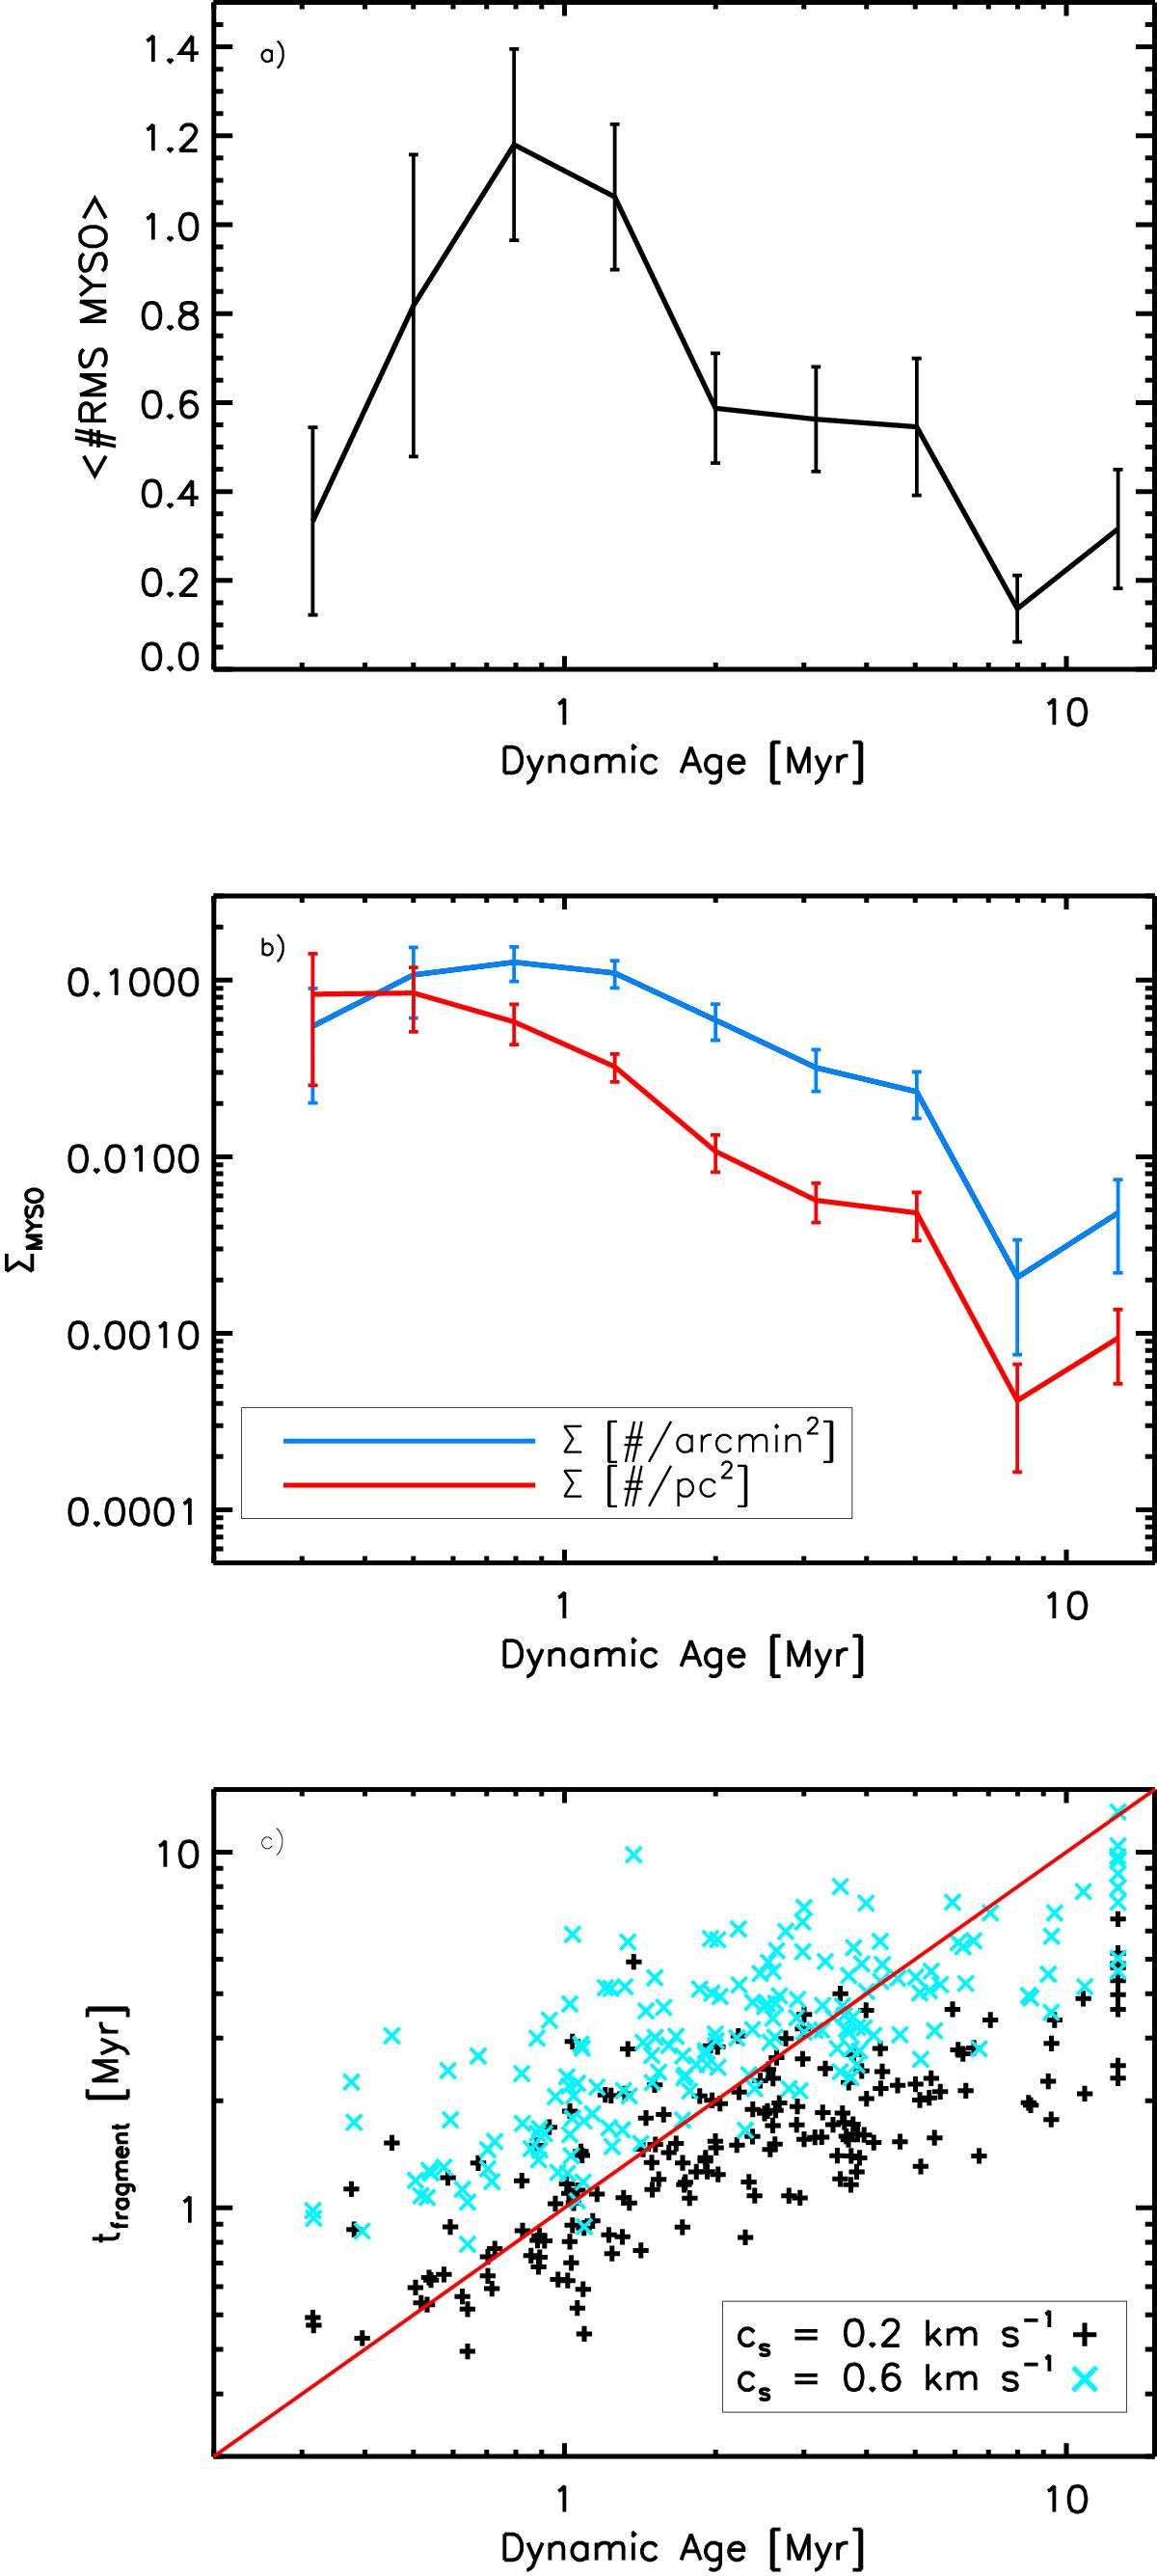
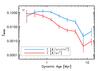
a) Average number of RMS sources as a function of dynamic age. b) Average apparent (in blue) and physical (in red) surface densities of RMS sources as a function of dynamic age. The error bars show the standard deviation of the mean (±![]() ). c) Fragmentation time as a function of dynamic time (Whitworth et al. 1994), assuming cs = 0.2 (in black) and 0.6 km s-1 (in blue). The solid red line represents the one-to-one relation.
). c) Fragmentation time as a function of dynamic time (Whitworth et al. 1994), assuming cs = 0.2 (in black) and 0.6 km s-1 (in blue). The solid red line represents the one-to-one relation.
Current usage metrics show cumulative count of Article Views (full-text article views including HTML views, PDF and ePub downloads, according to the available data) and Abstracts Views on Vision4Press platform.
Data correspond to usage on the plateform after 2015. The current usage metrics is available 48-96 hours after online publication and is updated daily on week days.
Initial download of the metrics may take a while.