Fig. 2
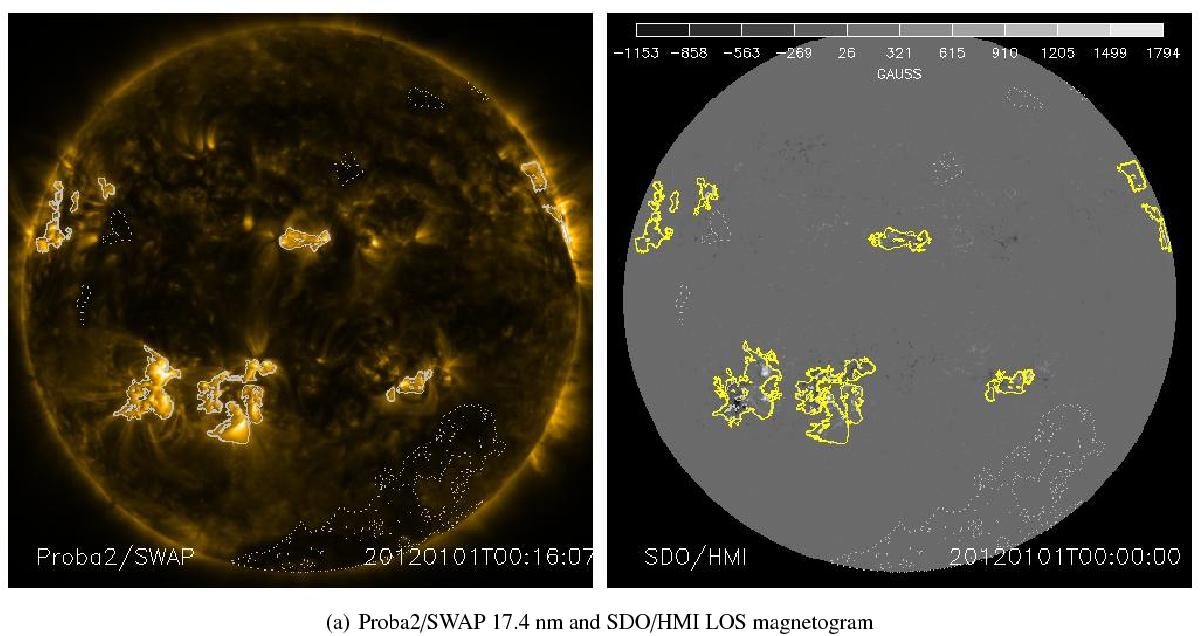
Left panel: segmentation maps resulting from the SPoCA algorithm applied on SWAP 17.4 nm image. The solid grey line indicates the segmented AR. The dotted grey line indicates the segmented CH. Right panel: photospheric magnetic features are identified in the HMI magnetogram using the SPoCA segmentation maps. The grey lines indicate the segmented features projected onto the magnetogram. The yellow line indicates the extended AR area. The temporal evolution over one month is shown by a movie available online.
Current usage metrics show cumulative count of Article Views (full-text article views including HTML views, PDF and ePub downloads, according to the available data) and Abstracts Views on Vision4Press platform.
Data correspond to usage on the plateform after 2015. The current usage metrics is available 48-96 hours after online publication and is updated daily on week days.
Initial download of the metrics may take a while.