Fig. 1
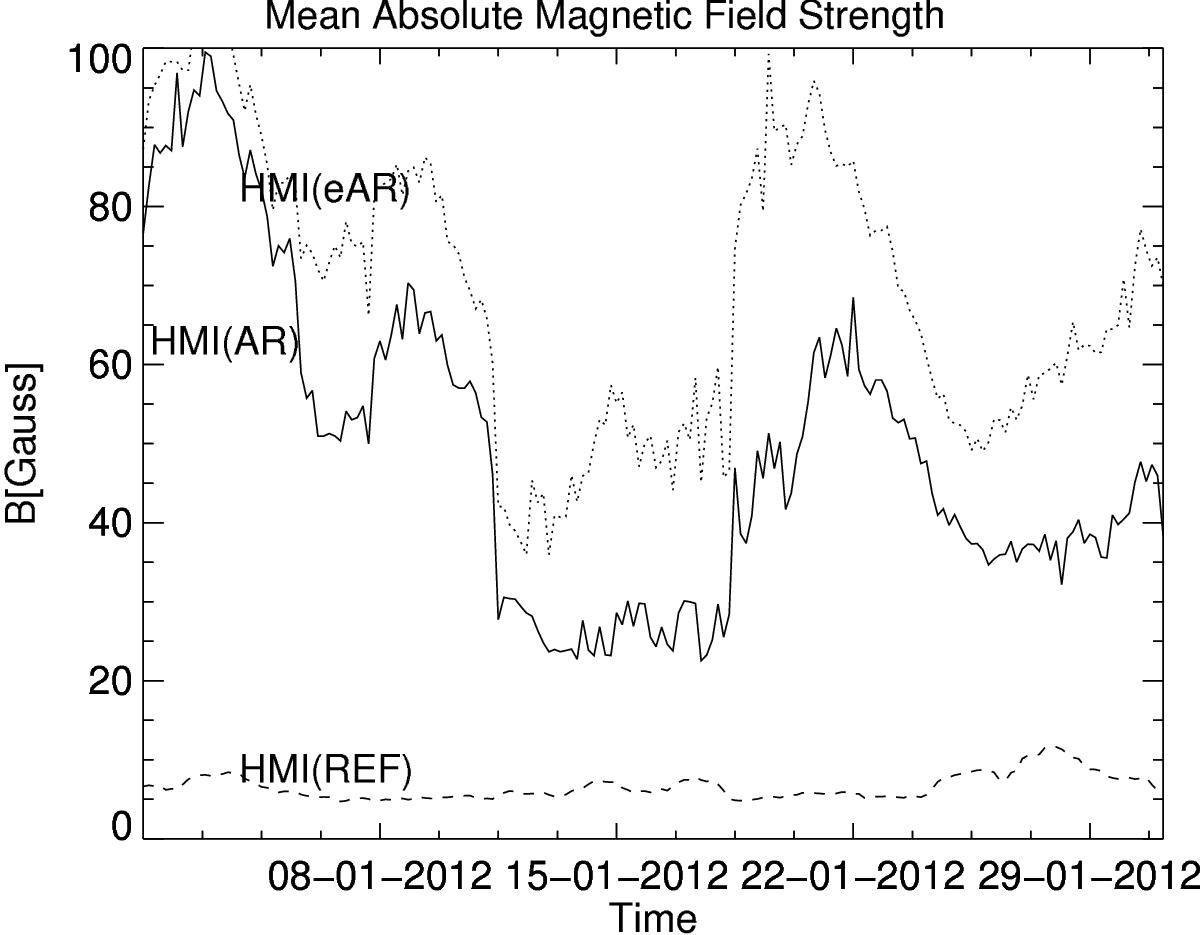
Mean values of the absolute magnetic field of the ARs, eARs, and a reference region for January 2012. The solid line represents the mean value obtained for each image of the absolute values of the magnetic field within an active region, the dotted line represents the corresponding values of the extended active region, and the dashed line represents the values of a reference region.
Current usage metrics show cumulative count of Article Views (full-text article views including HTML views, PDF and ePub downloads, according to the available data) and Abstracts Views on Vision4Press platform.
Data correspond to usage on the plateform after 2015. The current usage metrics is available 48-96 hours after online publication and is updated daily on week days.
Initial download of the metrics may take a while.