Fig. 9
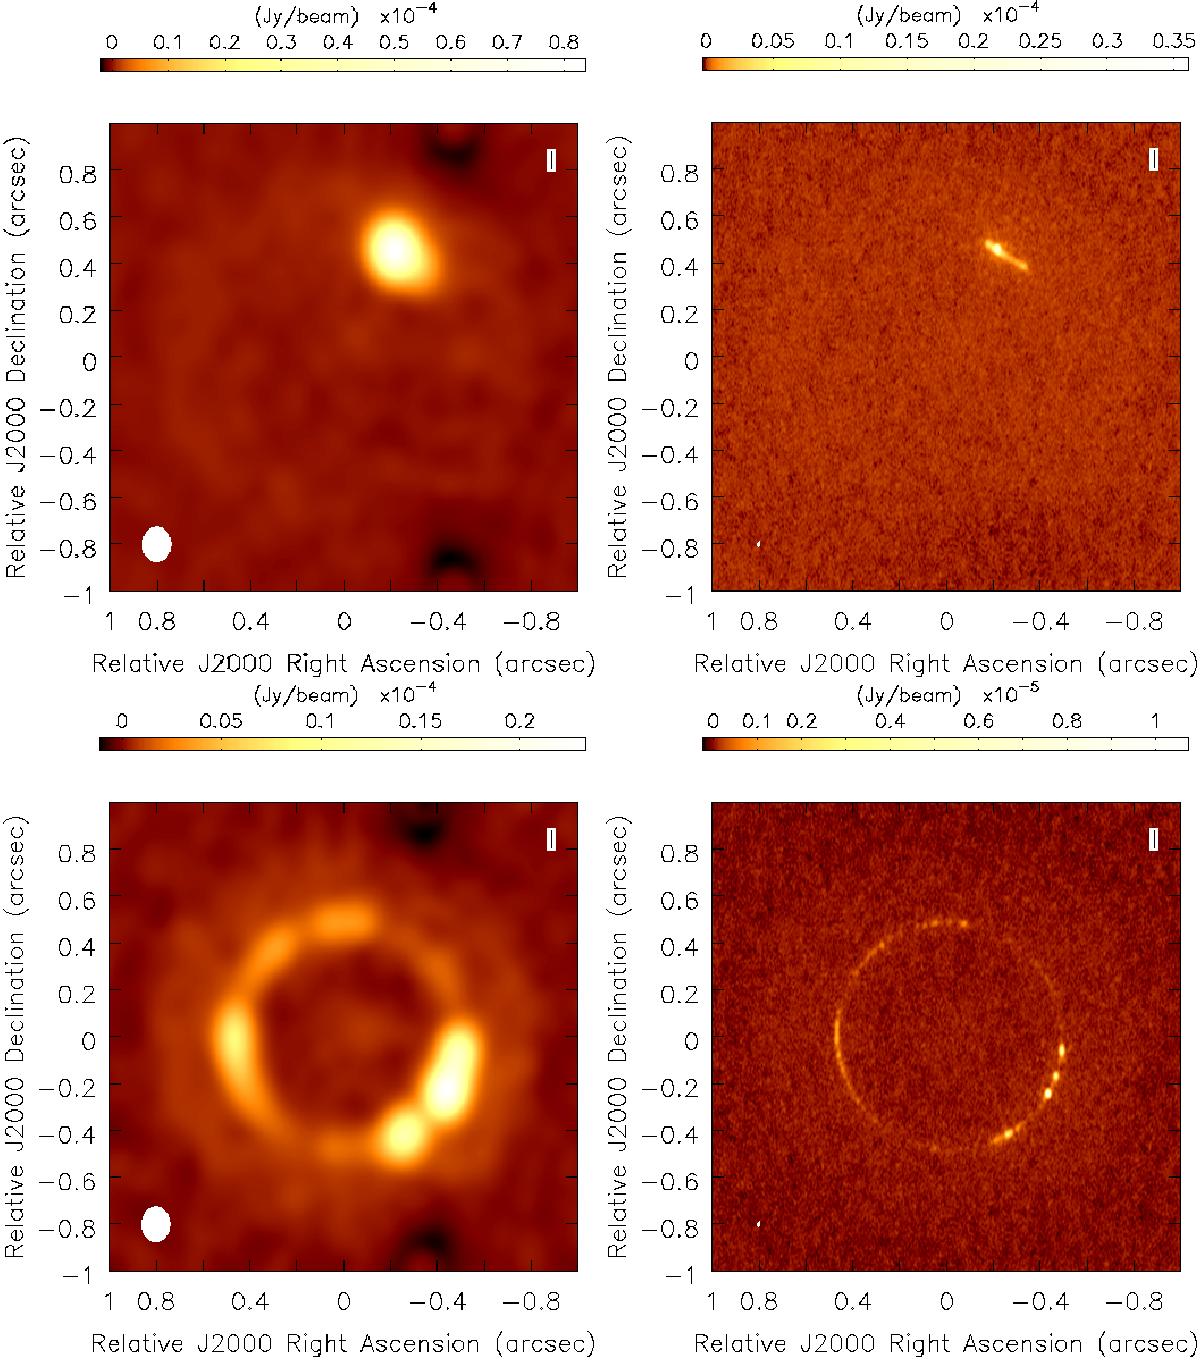
Simulated ngVLA images computed from the disk simulations illustrated in Fig. 1. Each map corresponds to a single particle size: 6.4 mm (λ = 3.7 mm) and 2.0 cm (λ = 1.0 cm), in top and bottom rows, respectively. The images in the left panels were obtained after tapering the interferometric visibilities with a 0.1 arcsec beam; the images in the right panels fully exploit the maximum angular resolution expected for the ngVLA at these wavelengths (see text).
Current usage metrics show cumulative count of Article Views (full-text article views including HTML views, PDF and ePub downloads, according to the available data) and Abstracts Views on Vision4Press platform.
Data correspond to usage on the plateform after 2015. The current usage metrics is available 48-96 hours after online publication and is updated daily on week days.
Initial download of the metrics may take a while.