Free Access
Fig. 2
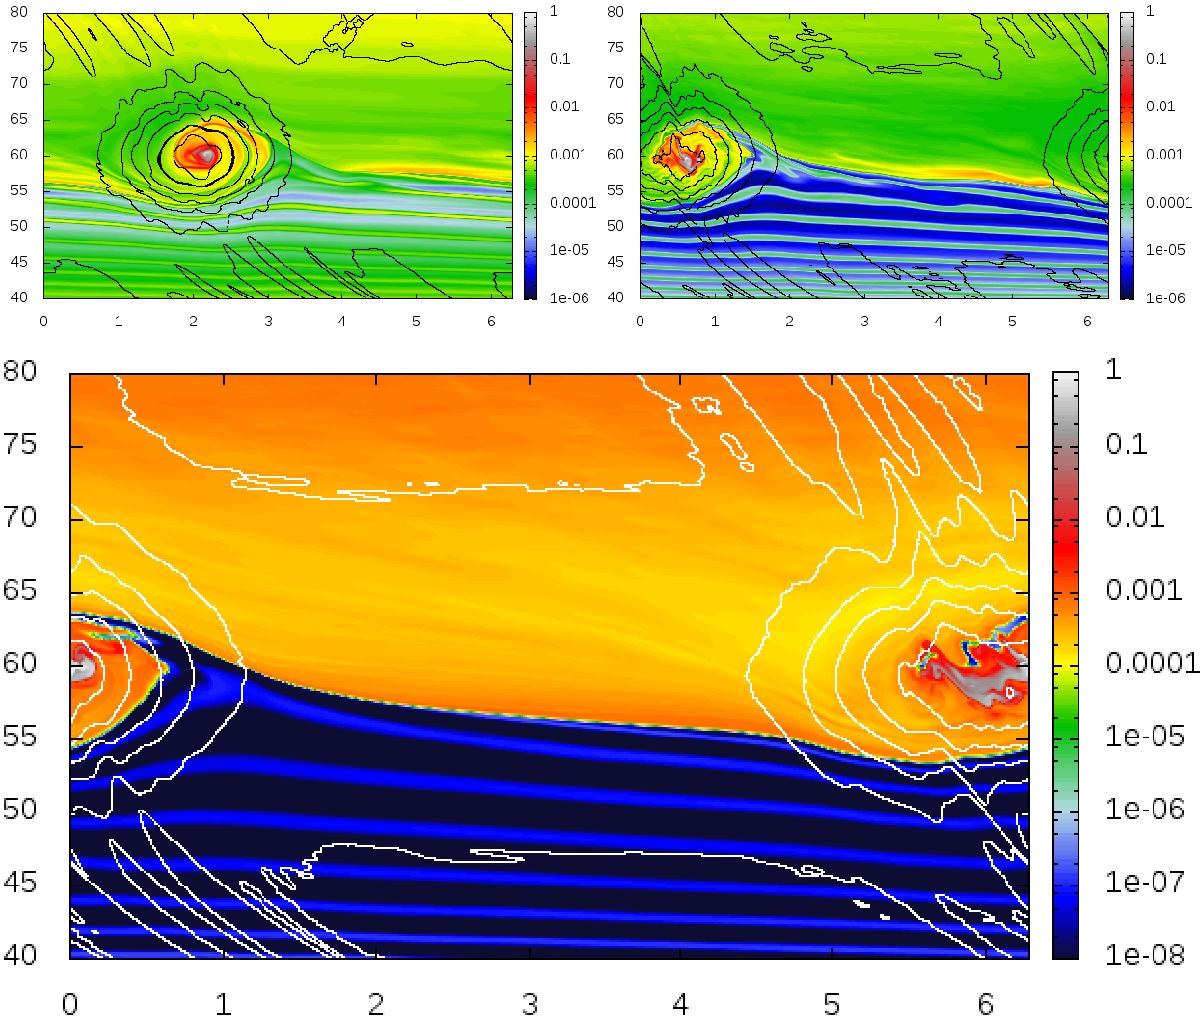
Dust-to-gas ratio for light particles of size s = 2 mm. The map is plotted in the (r,θ) plane and the evolution is shown after 20, 40 and 100 rotations of the vortex, from left to right and from top to bottom. Units of the x- and y-axis are in AU and radians, respectively.
Current usage metrics show cumulative count of Article Views (full-text article views including HTML views, PDF and ePub downloads, according to the available data) and Abstracts Views on Vision4Press platform.
Data correspond to usage on the plateform after 2015. The current usage metrics is available 48-96 hours after online publication and is updated daily on week days.
Initial download of the metrics may take a while.