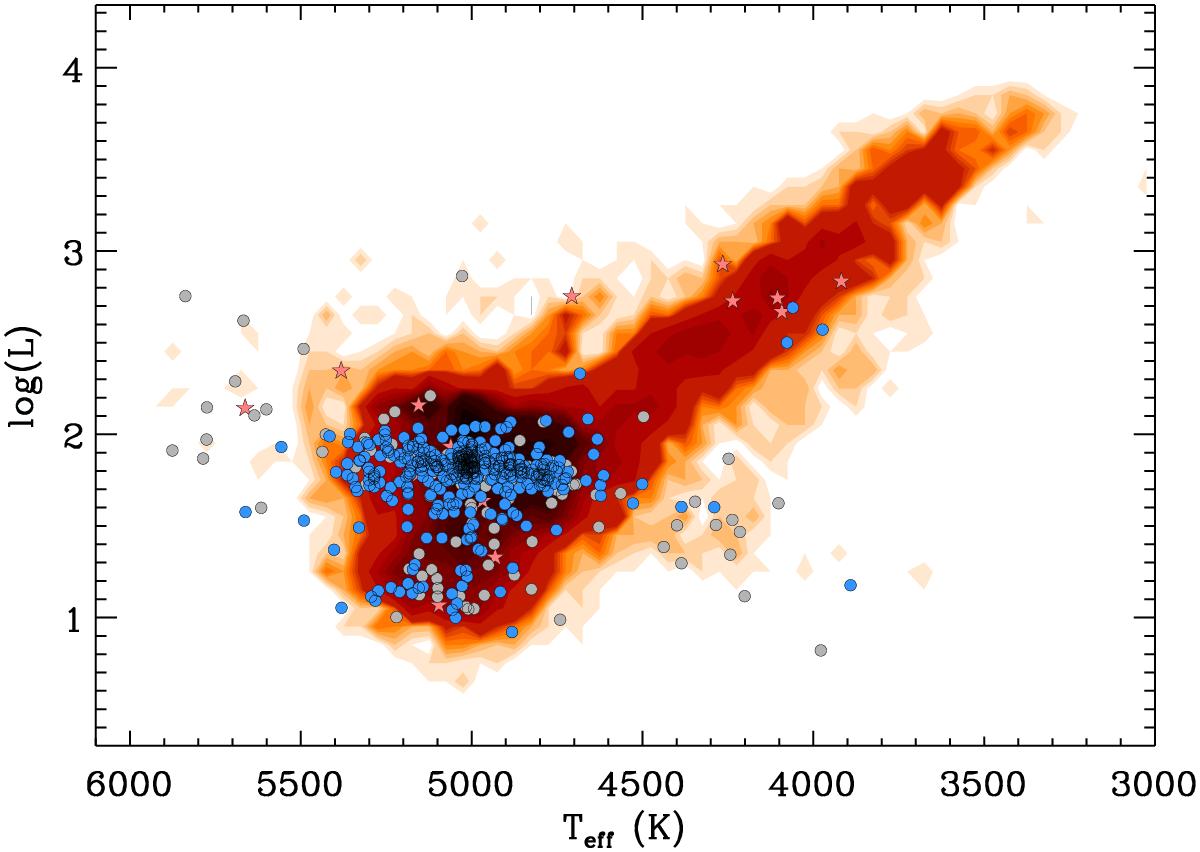
Fig. 1

Hertzsprung-Russell diagram of the full sample of red giants. The density map corresponds to the whole sample (17 377 stars). The grey dots are stars for which a rotational modulation is detected but that are discarded as probable pollution (151 stars). The magenta stars show the positions of the 19 stars removed according to the Tcrit criterion. The blue dots represent stars for which a reliable rotation period has been derived (361 stars). See Sect. 3 for details.
Current usage metrics show cumulative count of Article Views (full-text article views including HTML views, PDF and ePub downloads, according to the available data) and Abstracts Views on Vision4Press platform.
Data correspond to usage on the plateform after 2015. The current usage metrics is available 48-96 hours after online publication and is updated daily on week days.
Initial download of the metrics may take a while.


