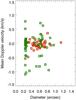
Fig. 7
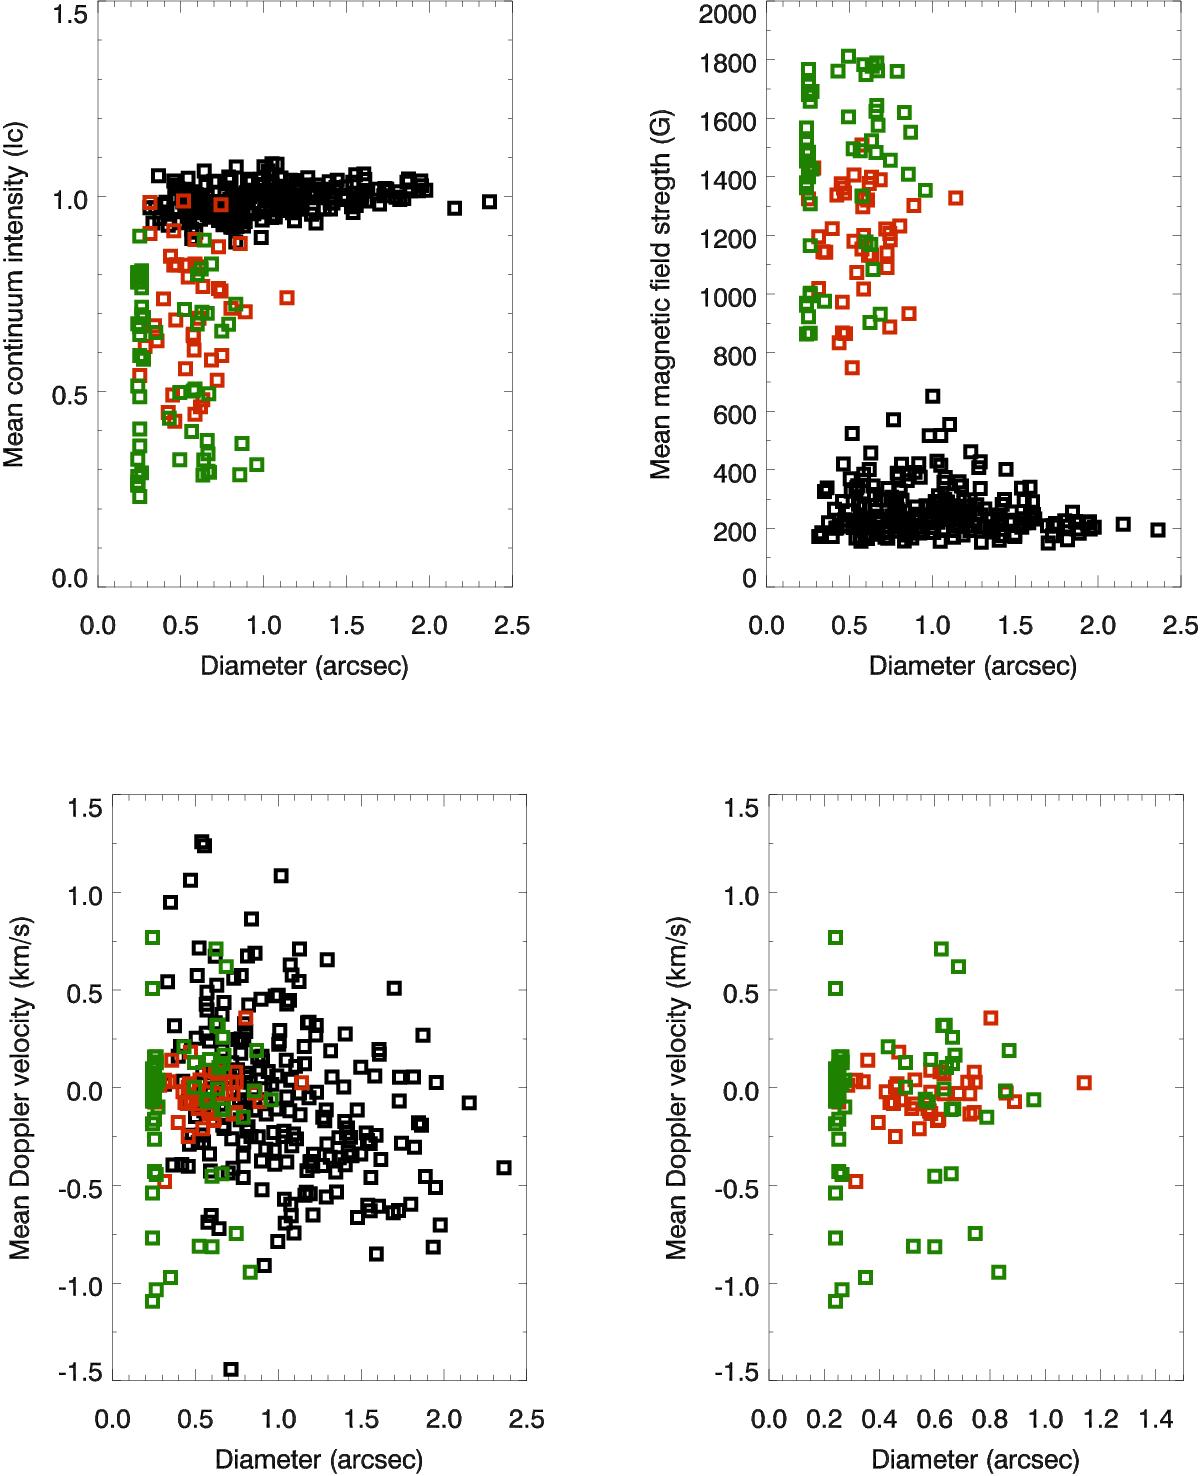
Scatter plots of diameter vs. mean continuum intensity (top-left panel), diameter vs. mean magnetic field strength (top-right panel) and diameter vs. mean Doppler velocity (bottom-left panel), concerning UDs, LBGs and PLGs. The bottom-right panel shows the diameter vs. mean Doppler velocity, concerning only UDs and LBGs. The green squares correspond to UDs, the red ones to LBGs, and the black ones to PLGs.
Current usage metrics show cumulative count of Article Views (full-text article views including HTML views, PDF and ePub downloads, according to the available data) and Abstracts Views on Vision4Press platform.
Data correspond to usage on the plateform after 2015. The current usage metrics is available 48-96 hours after online publication and is updated daily on week days.
Initial download of the metrics may take a while.