Fig. 9
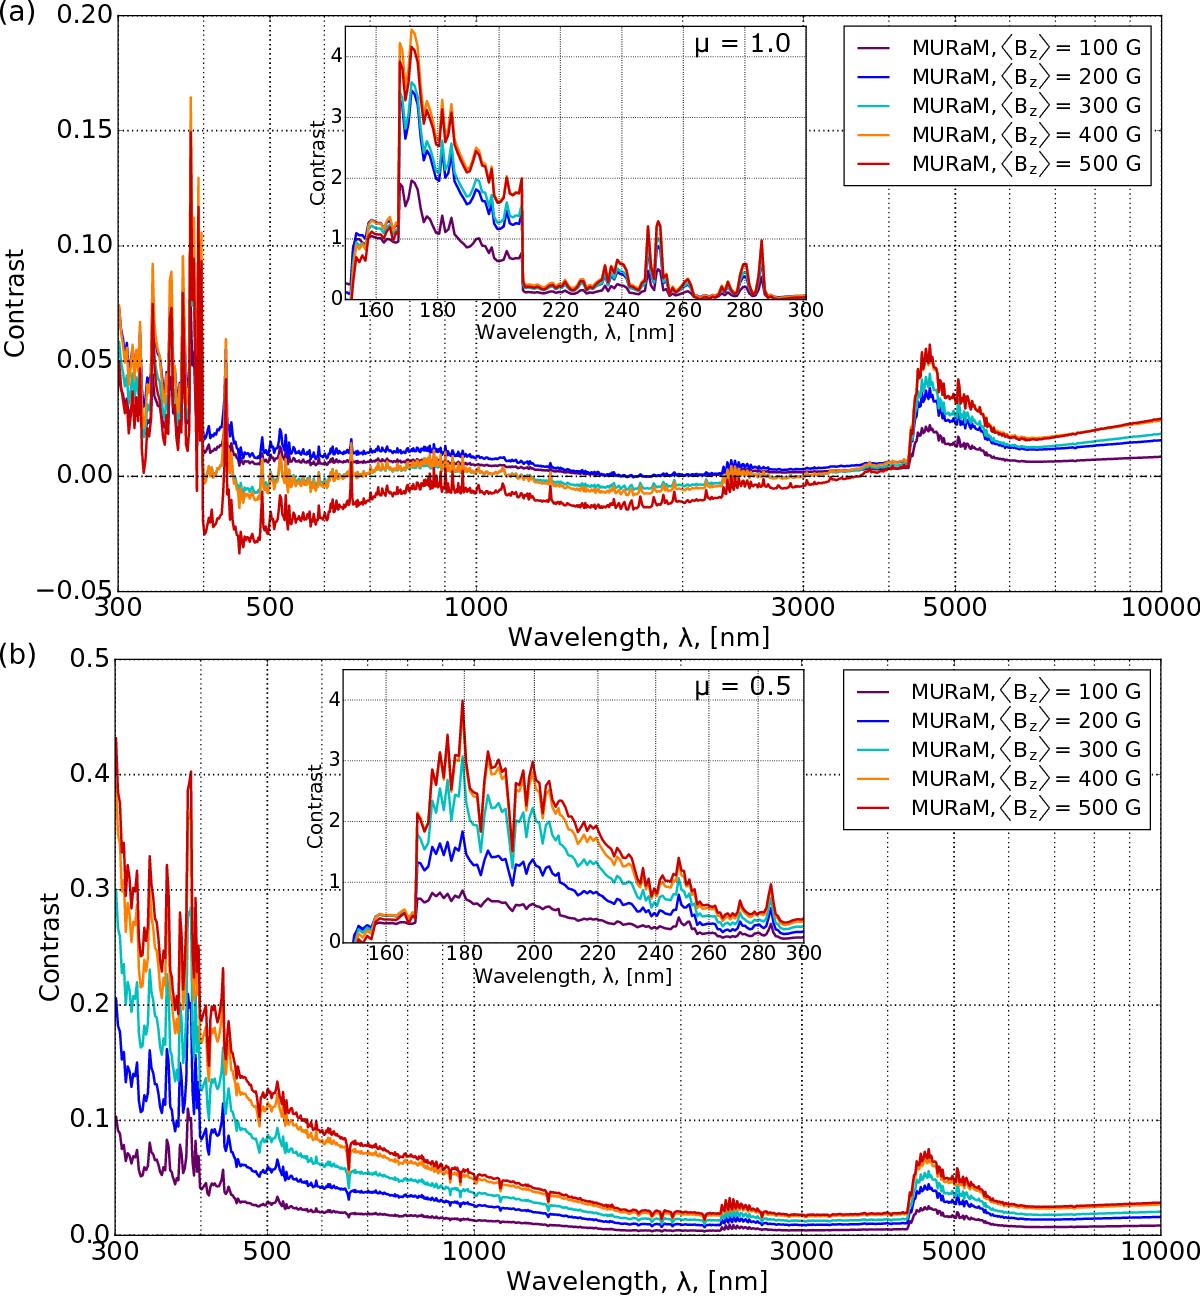
Average contrast spectra of all pixels for all snapshots of a given ⟨ Bz ⟩ relative to the average of the hydrodynamic snapshots shown for a wavelength range of 150 nm to 10 000 nm. The main plots show wavelengths of 300 nm to 10 000 nm using logarithmic x axes, while the insets show 150 nm to 300 nm using linear axes. These are shown at μ = 1.0 (top) and μ = 0.5 (bottom). Note the different vertical scales.
Current usage metrics show cumulative count of Article Views (full-text article views including HTML views, PDF and ePub downloads, according to the available data) and Abstracts Views on Vision4Press platform.
Data correspond to usage on the plateform after 2015. The current usage metrics is available 48-96 hours after online publication and is updated daily on week days.
Initial download of the metrics may take a while.