Fig. 8
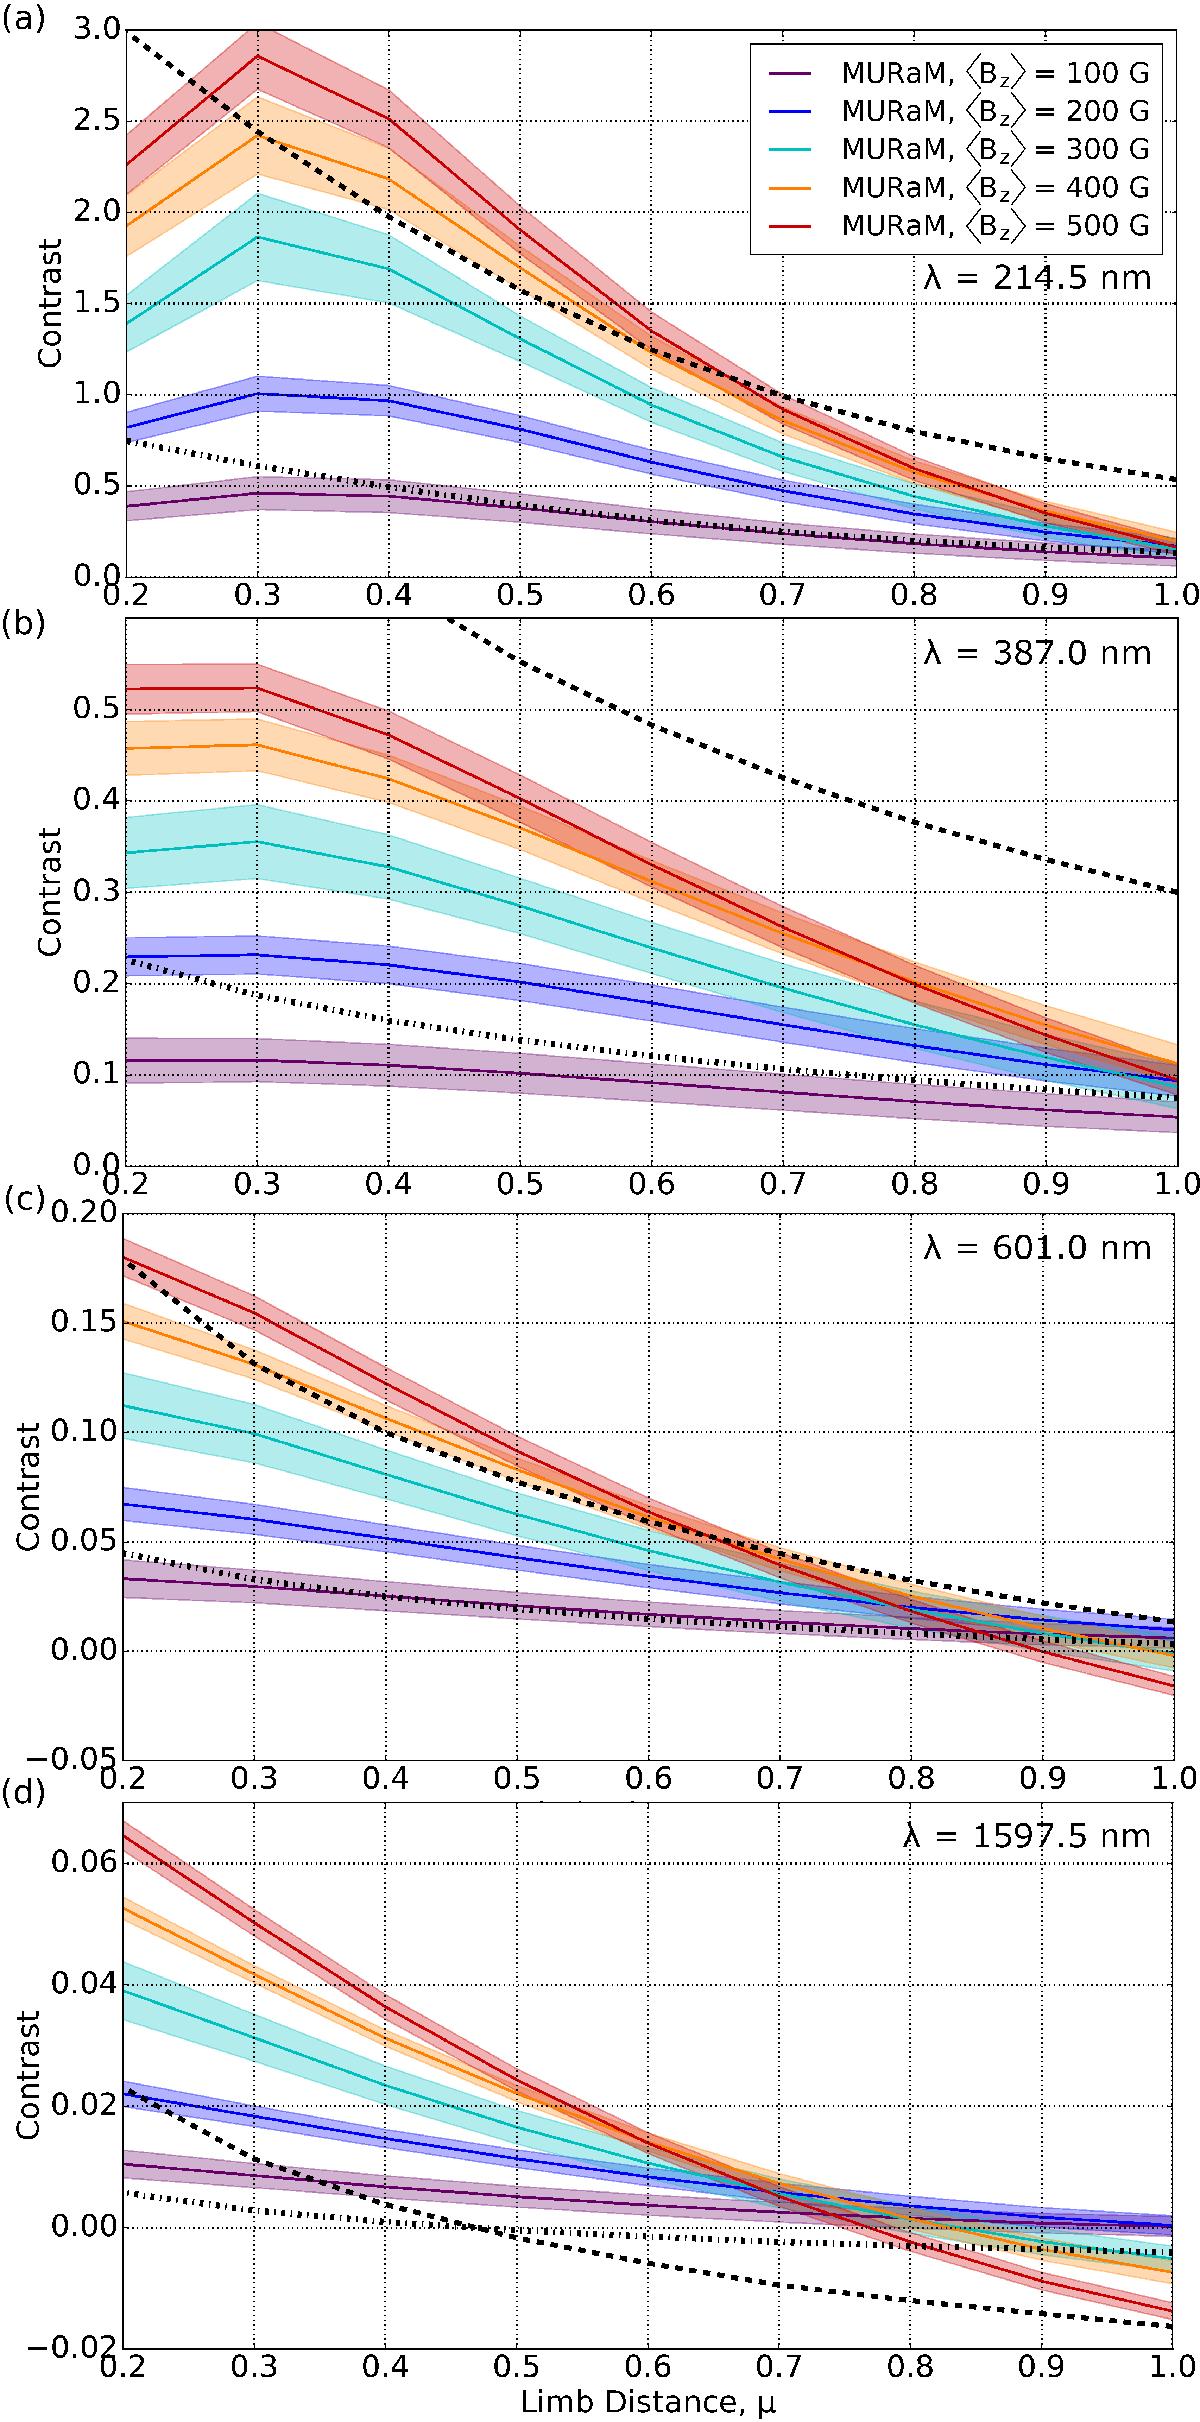
Average contrast vs limb distance, μ, of all pixels for all snapshots of a given ⟨ Bz ⟩ relative to the average intensity of the hydrodynamic snapshots. These are shown for 214.5 nm (a), 387 nm (b), 601 nm (c) and 1.5975 μm (d). The shaded regions show the spread calculated from the standard deviations of the means of the snapshots at each μ, incorporating both the magnetic and hydrodynamic spreads. Colours corresponding to ⟨ Bz ⟩ are given in the legend of the figure. The dashed and dash-dotted lines show contrasts derived for 1D facular model (see text) with a 100% and a 25% filling factor, respectively.
Current usage metrics show cumulative count of Article Views (full-text article views including HTML views, PDF and ePub downloads, according to the available data) and Abstracts Views on Vision4Press platform.
Data correspond to usage on the plateform after 2015. The current usage metrics is available 48-96 hours after online publication and is updated daily on week days.
Initial download of the metrics may take a while.