Fig. 7
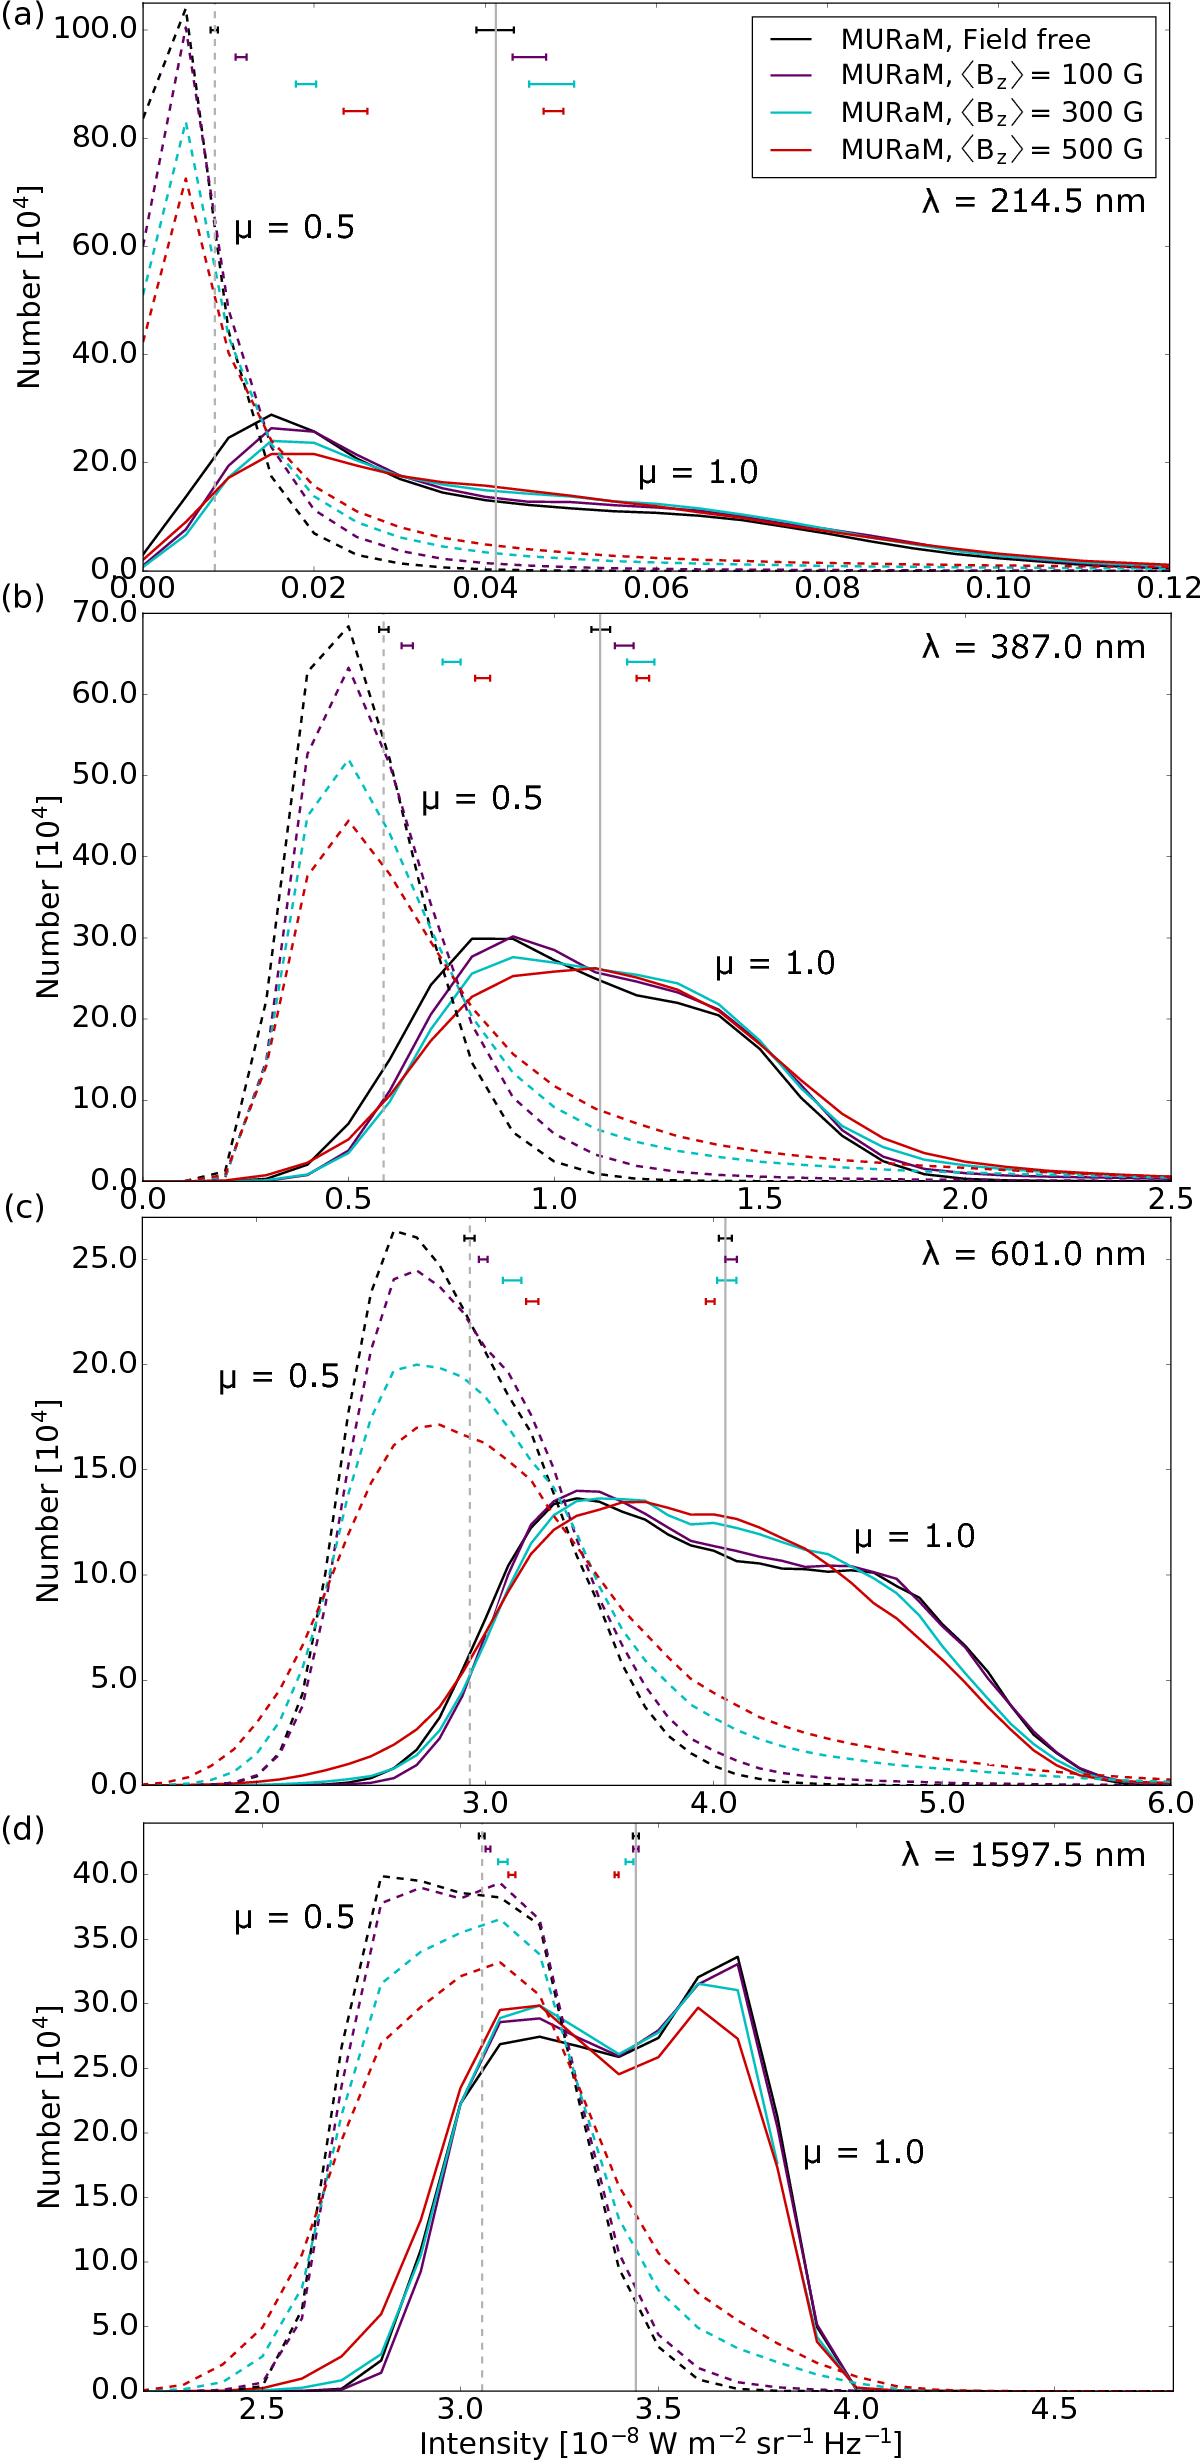
Histograms of intensity for all pixels in all snapshots for a given ⟨ Bz ⟩ shown in the legend. The field-free mean intensities (averaged over all field-free snapshots) are marked by grey vertical lines with the minimum and maximum values of the mean intensities of the individual field-free snapshots indicated by black horizontal bars. Also shown are histograms and the range of snapshot-averaged intensities for simulations with ⟨ Bz ⟩ of 100 G (purple), 300 G (cyan) and 500 G (red). The histograms are shown at two different limb positions: μ = 1.0 (solid curves) and μ = 0.5 (dashed curves). Panel a shows histograms for a wavelength of 214.5 nm with a bin width of 5 × 10-11 W m-2 sr-1 Hz-1. Panels b–d show wavelengths of 387, 601 and 1597.5 nm respectively, with a bin width of 1 × 10⁻⁹ W m-2 sr-1 Hz-1. Both, the x and the y scale vary between graphs.
Current usage metrics show cumulative count of Article Views (full-text article views including HTML views, PDF and ePub downloads, according to the available data) and Abstracts Views on Vision4Press platform.
Data correspond to usage on the plateform after 2015. The current usage metrics is available 48-96 hours after online publication and is updated daily on week days.
Initial download of the metrics may take a while.