Fig. 5
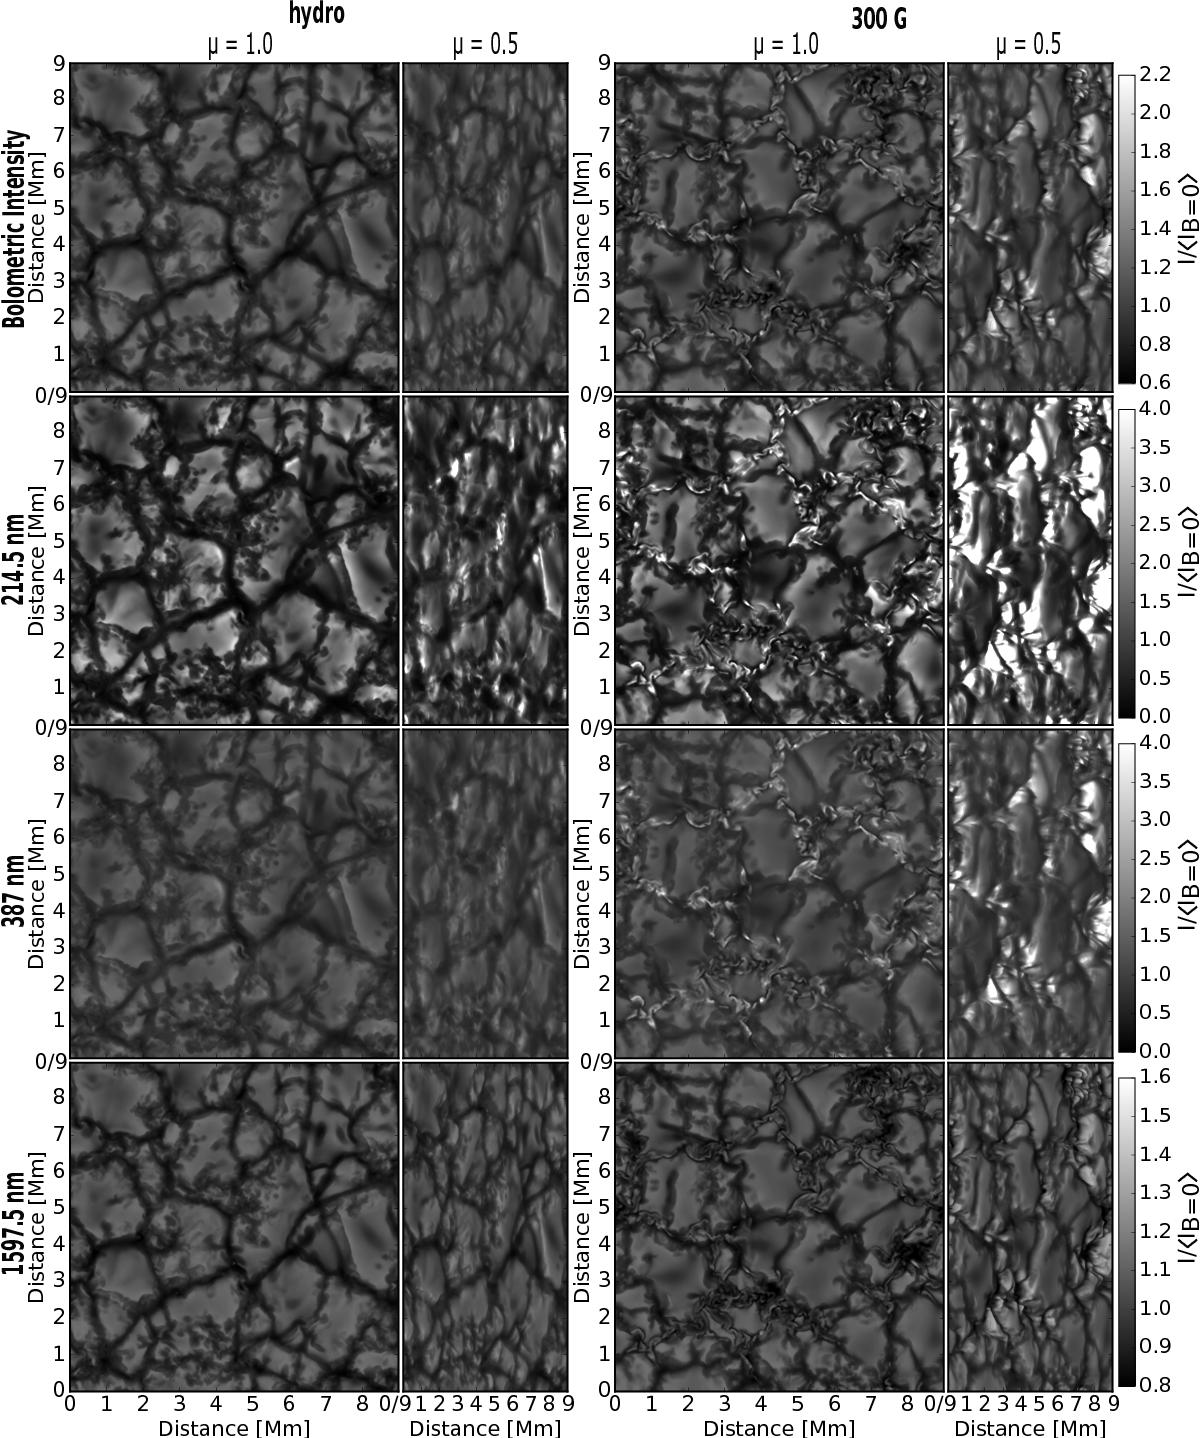
Emergent intensities from a G2 simulated atmospheric snapshot divided by the mean intensity of the field-free simulations for the same wavelengths and limb angles. The images are shown for a field-free snapshot (left column) and ⟨ Bz ⟩ = 300 G (right column). Two limb distances are shown in each column μ = 1.0 (left) and 0.5 (right). Images from top to bottom: bolometric intensity and intensities for the 214.5 nm, 387 nm and 1.5975 μm ATLAS9 wavelength bins. These snapshots are the same as shown in Fig. 2. Note the different normalised intensity ranges for the different wavelength bins (grey-scale bars on the right). Additional Figs. A.1 and A.2 show equivalent images from the remaining initial magnetic field simulations.
Current usage metrics show cumulative count of Article Views (full-text article views including HTML views, PDF and ePub downloads, according to the available data) and Abstracts Views on Vision4Press platform.
Data correspond to usage on the plateform after 2015. The current usage metrics is available 48-96 hours after online publication and is updated daily on week days.
Initial download of the metrics may take a while.