Fig. 9
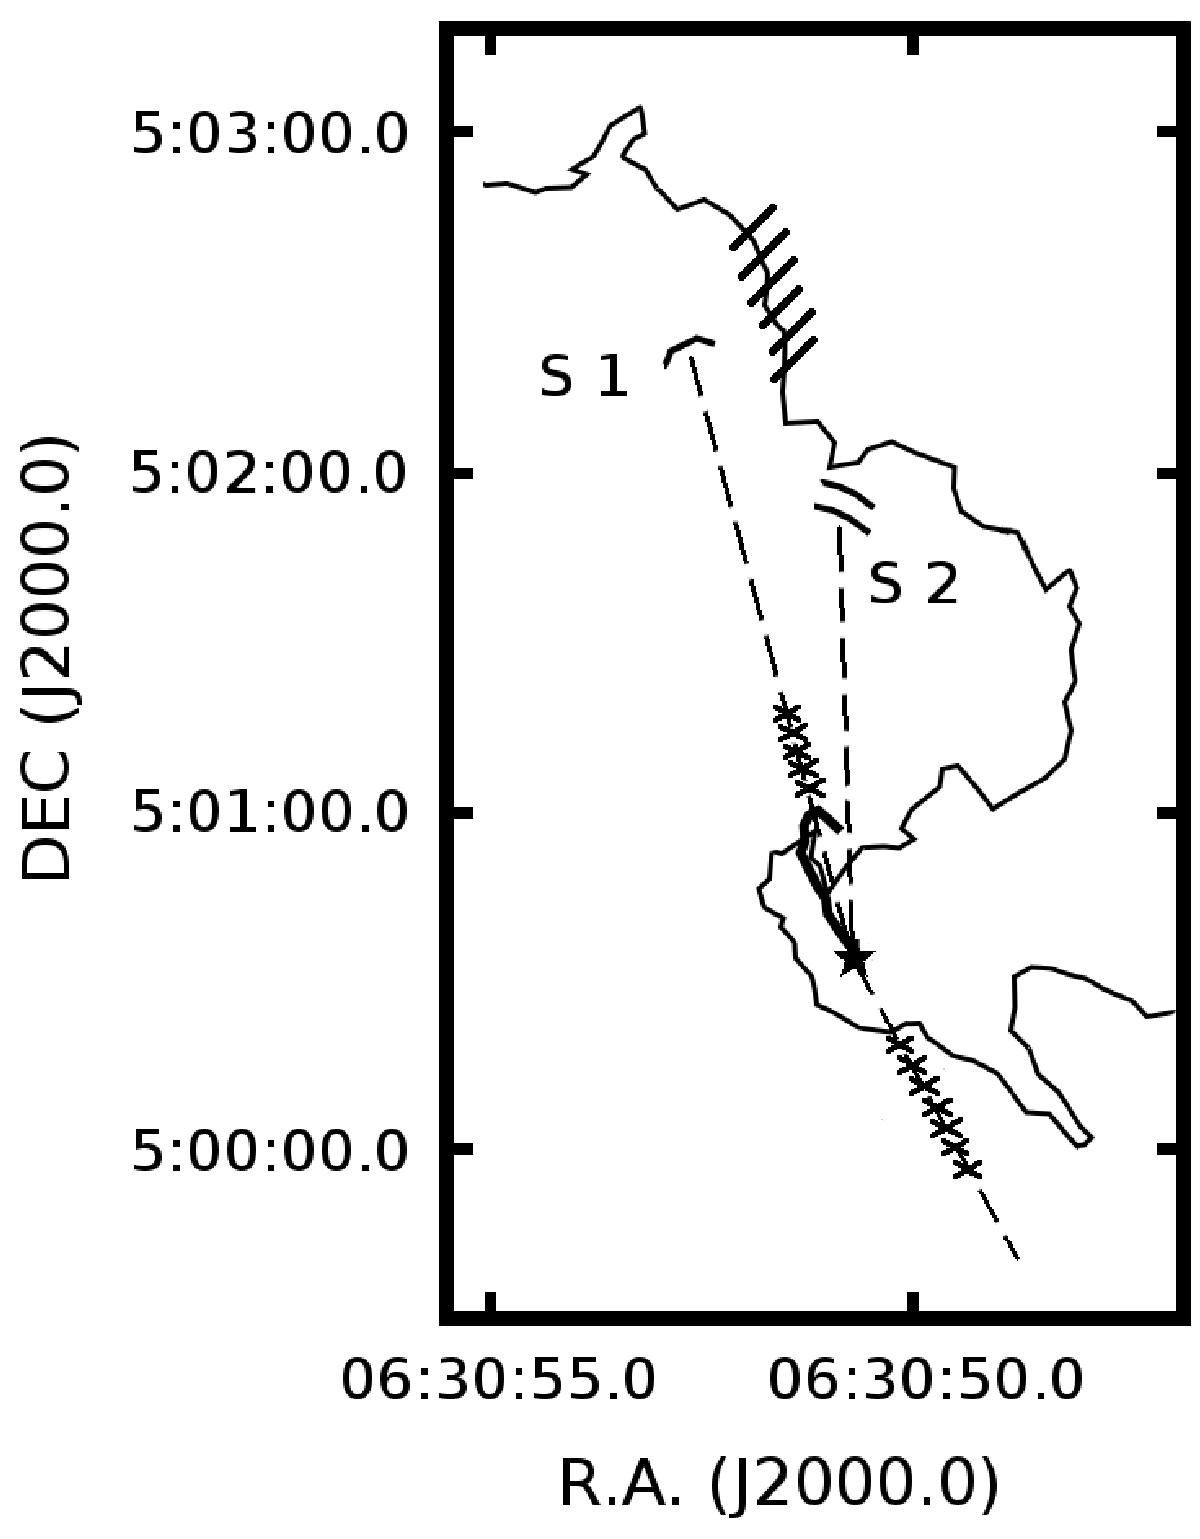
Sketch of the RN A outflow. The H2 outflow cavity is drawn with a thick solid line in RN A and the outflow central source is marked with a star. The short arcs marked S 1 and S 2 display the positions of the Hα bowshocks. The dashed lines have been drawn from the outflow source through the Hα knots, which are marked with “x” to indicate the direction of the possible outflow. The short lines on the shell display the section that is bright in the IRAC bands.
Current usage metrics show cumulative count of Article Views (full-text article views including HTML views, PDF and ePub downloads, according to the available data) and Abstracts Views on Vision4Press platform.
Data correspond to usage on the plateform after 2015. The current usage metrics is available 48-96 hours after online publication and is updated daily on week days.
Initial download of the metrics may take a while.