Fig. 8
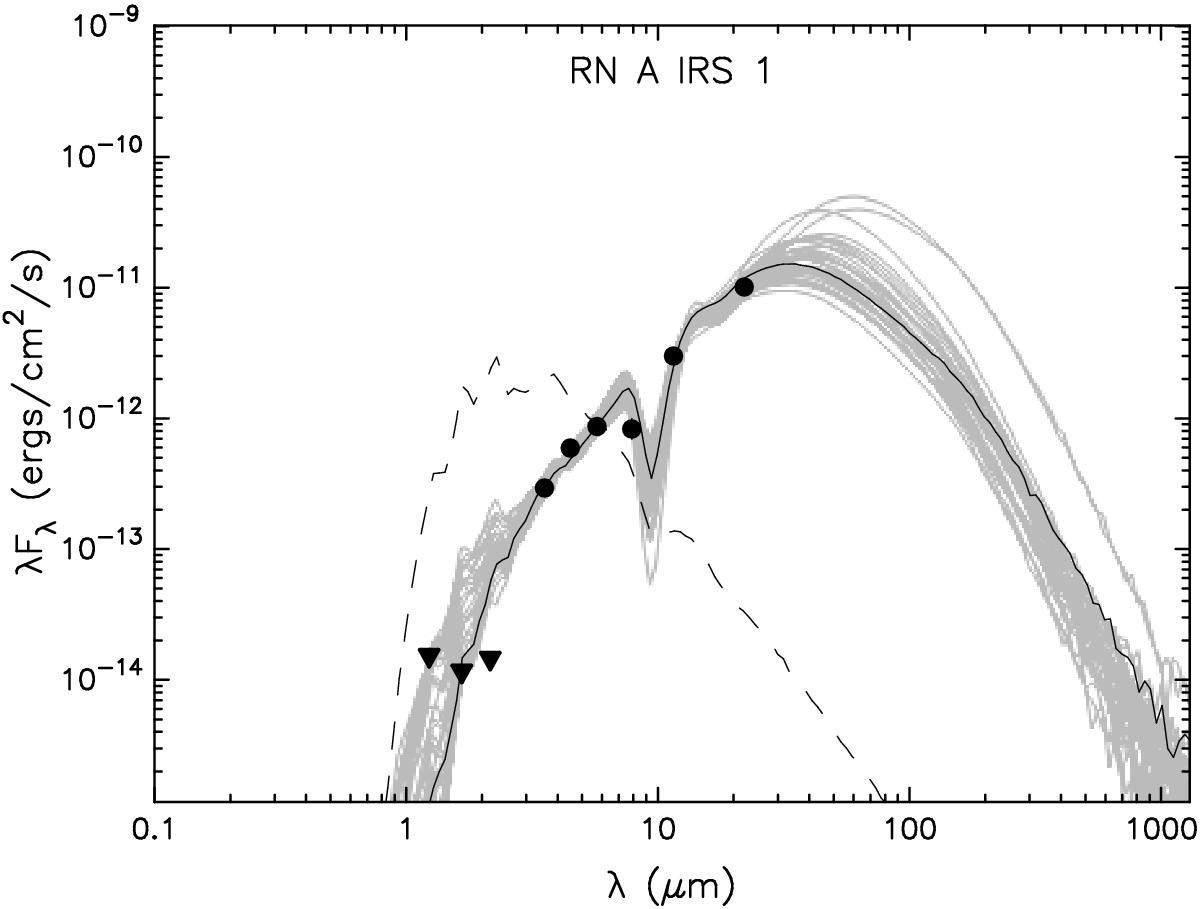
SED for RN A IRS 1. The triangles show the SOFI JHKs limiting magnitudes as upper limits. The circles show the flux values for IRAC and the WISE 12 and 22 μm fluxes. The best fit is shown with a solid black line, and fits with ![]() are shown with gray lines. The dashed line is the stellar photosphere of the best fit including the reddening by interstellar extinction.
are shown with gray lines. The dashed line is the stellar photosphere of the best fit including the reddening by interstellar extinction.
Current usage metrics show cumulative count of Article Views (full-text article views including HTML views, PDF and ePub downloads, according to the available data) and Abstracts Views on Vision4Press platform.
Data correspond to usage on the plateform after 2015. The current usage metrics is available 48-96 hours after online publication and is updated daily on week days.
Initial download of the metrics may take a while.