Fig. 6
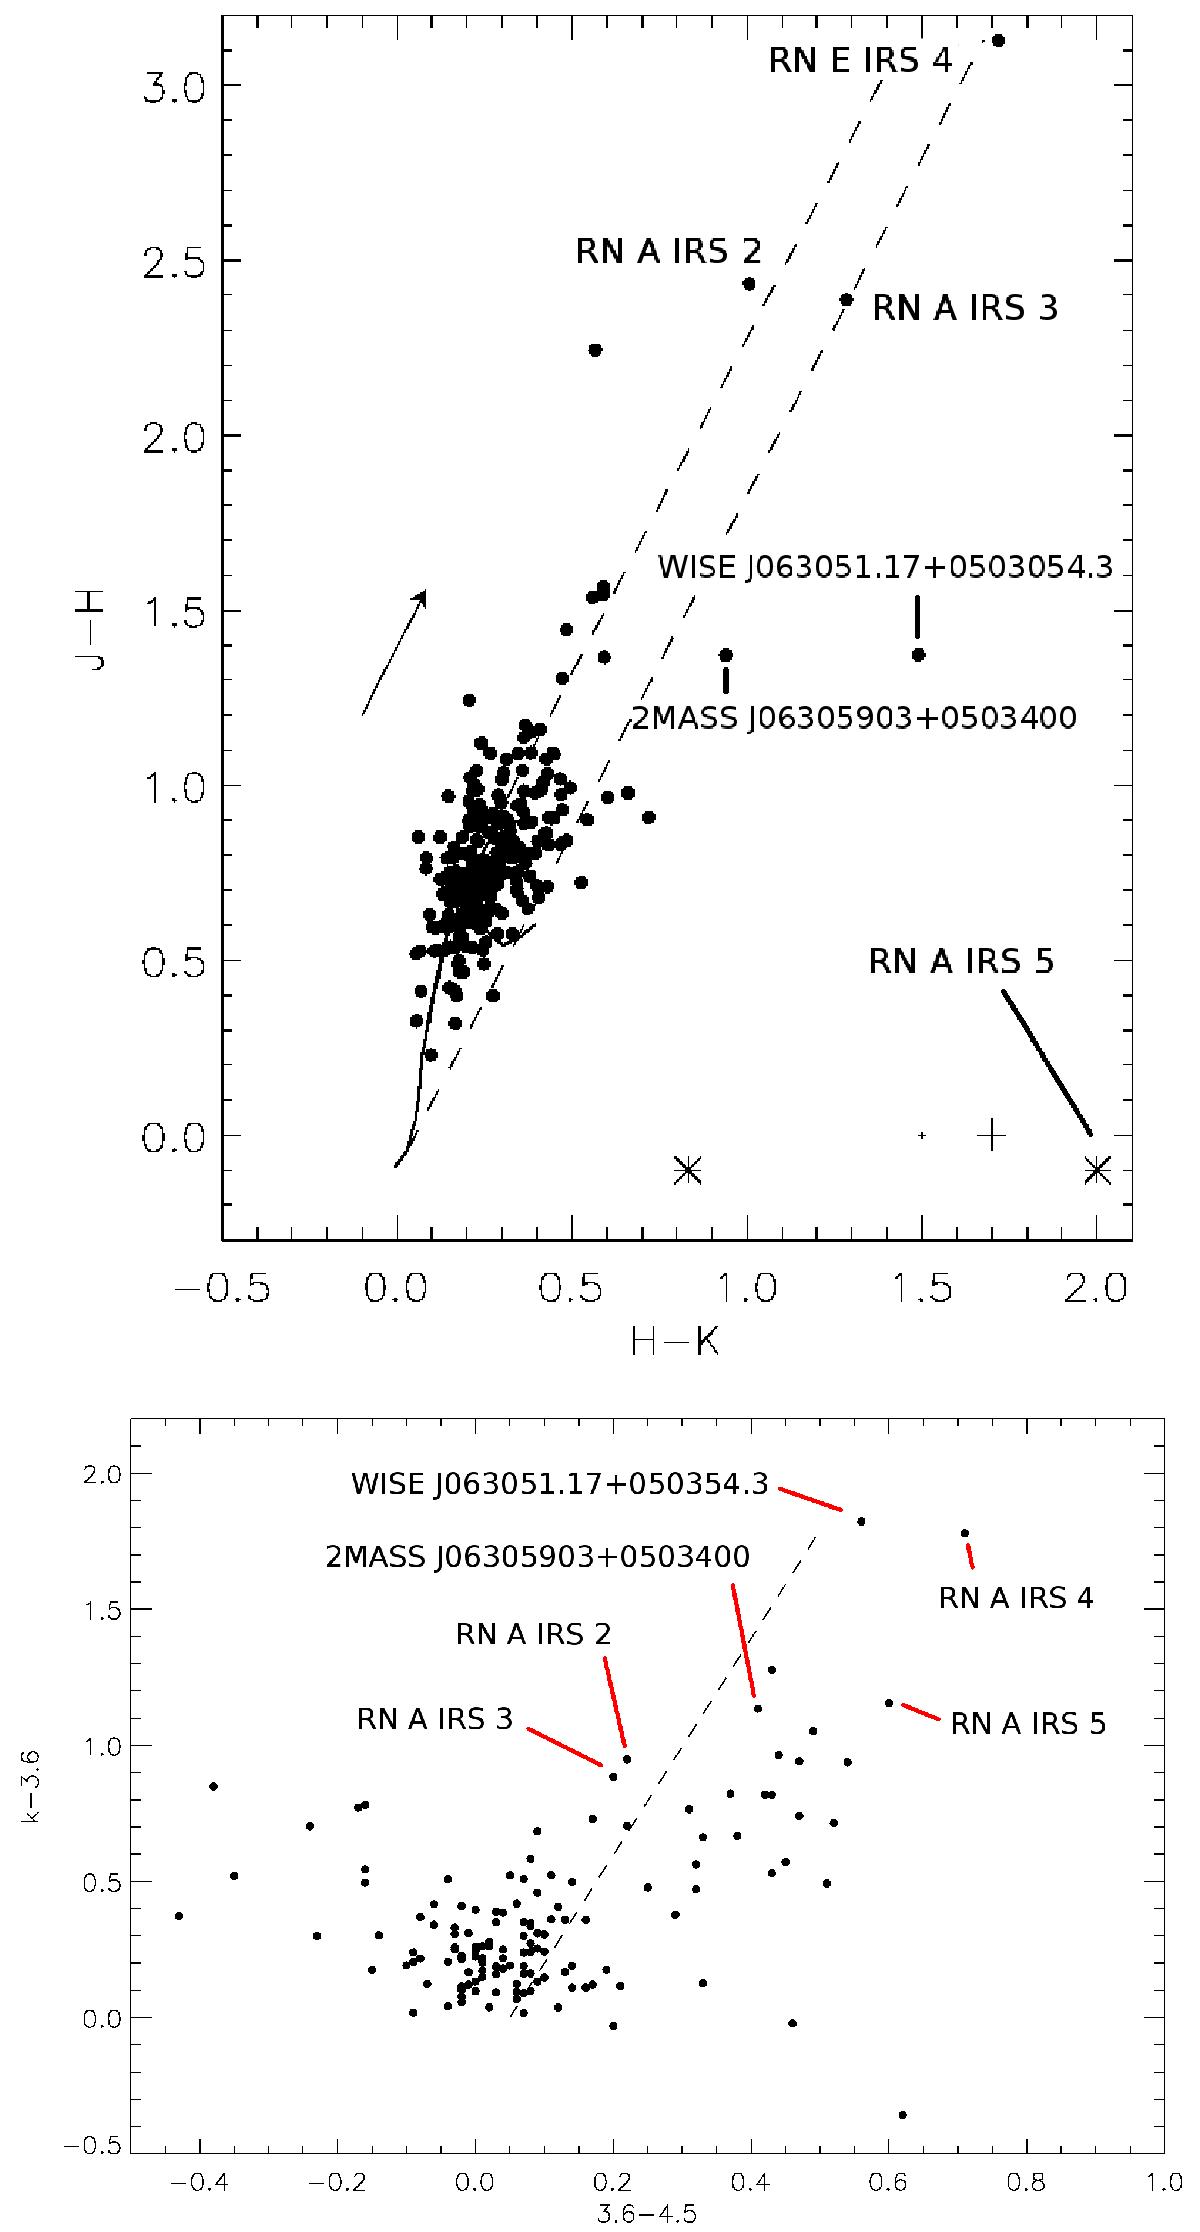
Top: J − H, H − Ks color-color diagram of the objects in the observed SOFI field. Filled circles mark the final photometry catalog stars. Seven stars have been added from the 2MASS PSC catalog as their SOFI data were saturated. The dashed lines are the reddening lines, and the arrow is a 3 mag reddening vector. The BB88 reddening law has been used. The crosses mark stars detected only in H and Ks. The plus signs in the lower righthand corner mark the sizes of the average (left) and the maximum (right) error of the colors. Bottom: Ks–[3.6] vs. [3.6]–[4.5] color-color diagram. The dashed line is in the direction of the reddening vector (adapted from Hartmann et al. 2005; Winston et al. 2007), and IR excess objects lie right of the line.
Current usage metrics show cumulative count of Article Views (full-text article views including HTML views, PDF and ePub downloads, according to the available data) and Abstracts Views on Vision4Press platform.
Data correspond to usage on the plateform after 2015. The current usage metrics is available 48-96 hours after online publication and is updated daily on week days.
Initial download of the metrics may take a while.