Fig. 4
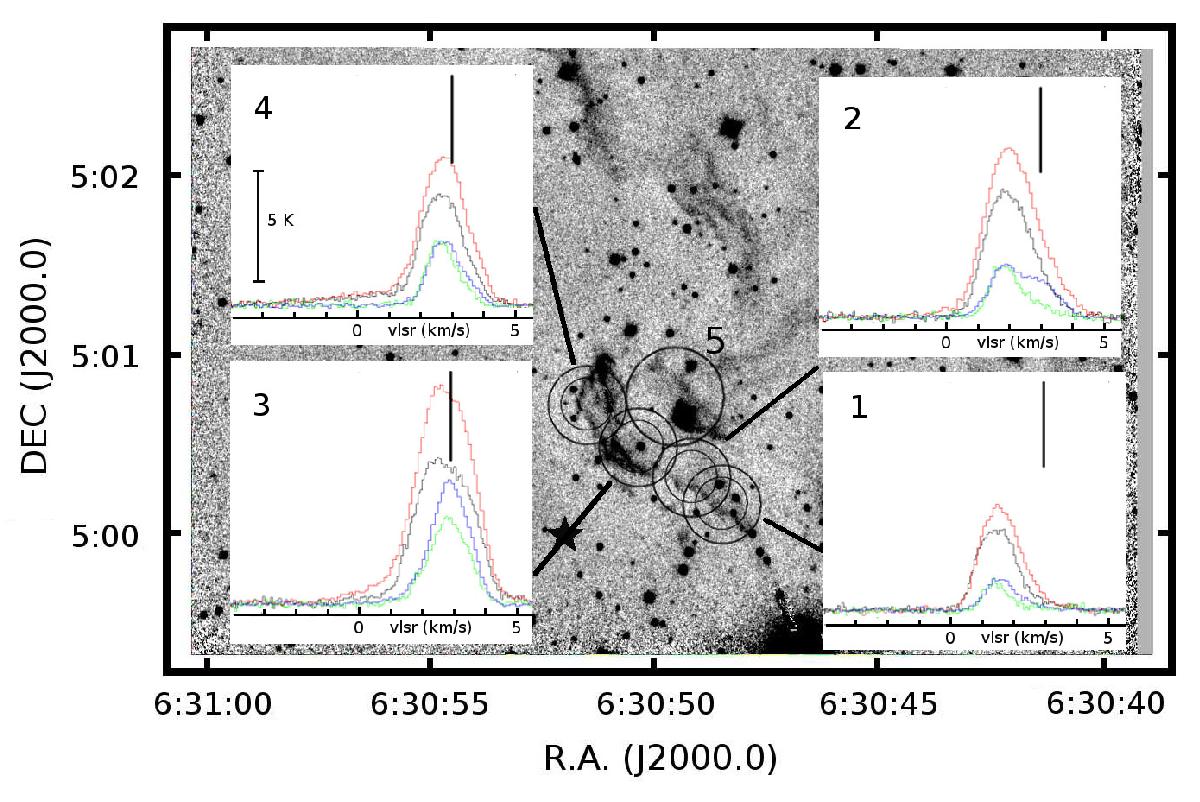
APEX beams and the observed spectra superposed on the RN A H2 2.12 μm image. The circle sizes correspond to the APEX FWHM at 230 GHz (27′′) and 345 GHz (18′′). The tickline in the spectra is at vLSR = 3km s-1. The ![]() (3–2) and (2–1) are black and red, and
(3–2) and (2–1) are black and red, and ![]() (3–2) and (2–1) lines are green and blue, respectively. The scale in the spectra is
(3–2) and (2–1) lines are green and blue, respectively. The scale in the spectra is ![]() . The circle with a thick line corresponds with the Shell A position of G13 and the star displays the OFF position.
. The circle with a thick line corresponds with the Shell A position of G13 and the star displays the OFF position.
Current usage metrics show cumulative count of Article Views (full-text article views including HTML views, PDF and ePub downloads, according to the available data) and Abstracts Views on Vision4Press platform.
Data correspond to usage on the plateform after 2015. The current usage metrics is available 48-96 hours after online publication and is updated daily on week days.
Initial download of the metrics may take a while.