Free Access
Fig. 3
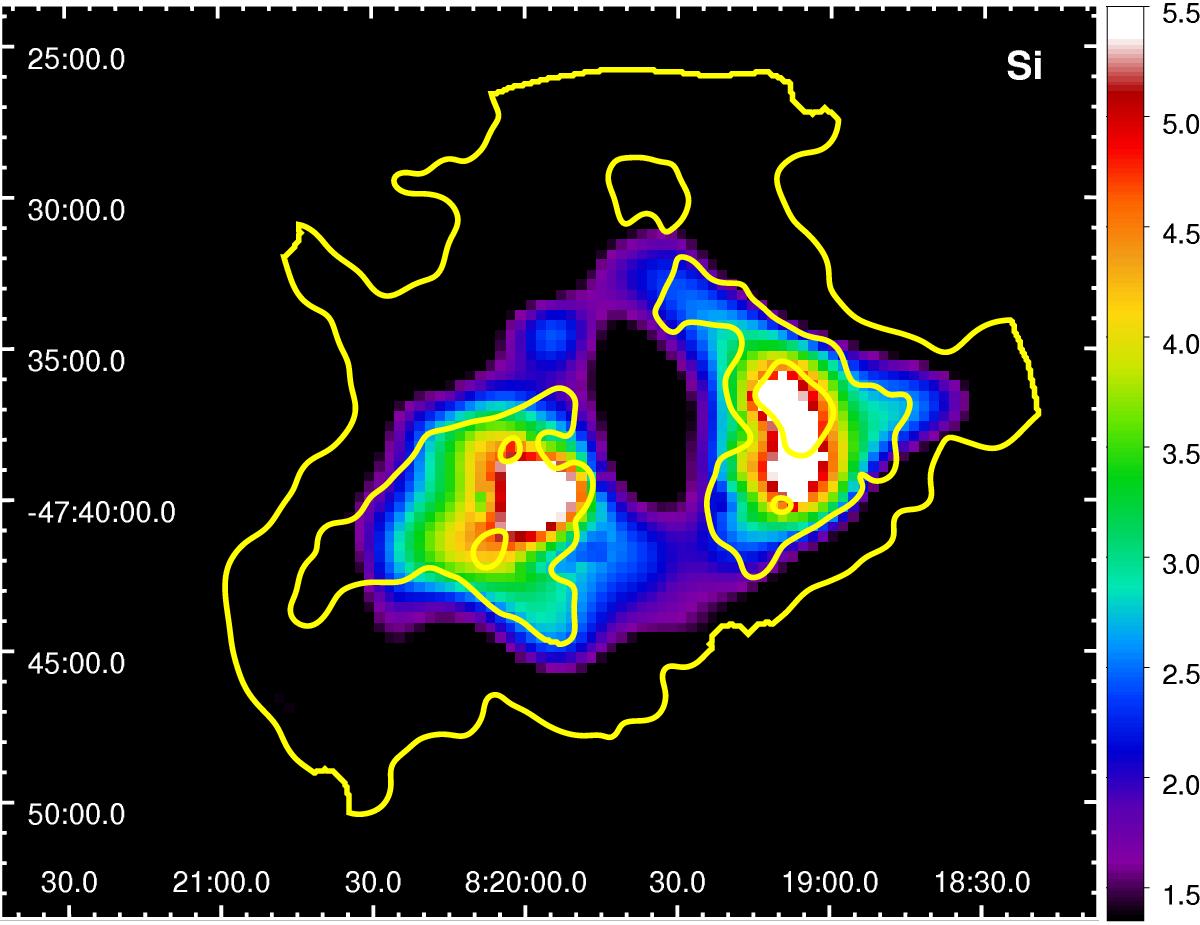
Background- and vignetting-corrected count-rate map in the 1.3−2.0 keV energy range, corresponding to the Si band. The overlaid yellow contours represent the emission in the 0.3−3.0 keV range. The Si maxima match the two bright knots of X-ray emission well.
Current usage metrics show cumulative count of Article Views (full-text article views including HTML views, PDF and ePub downloads, according to the available data) and Abstracts Views on Vision4Press platform.
Data correspond to usage on the plateform after 2015. The current usage metrics is available 48-96 hours after online publication and is updated daily on week days.
Initial download of the metrics may take a while.