Fig. 3
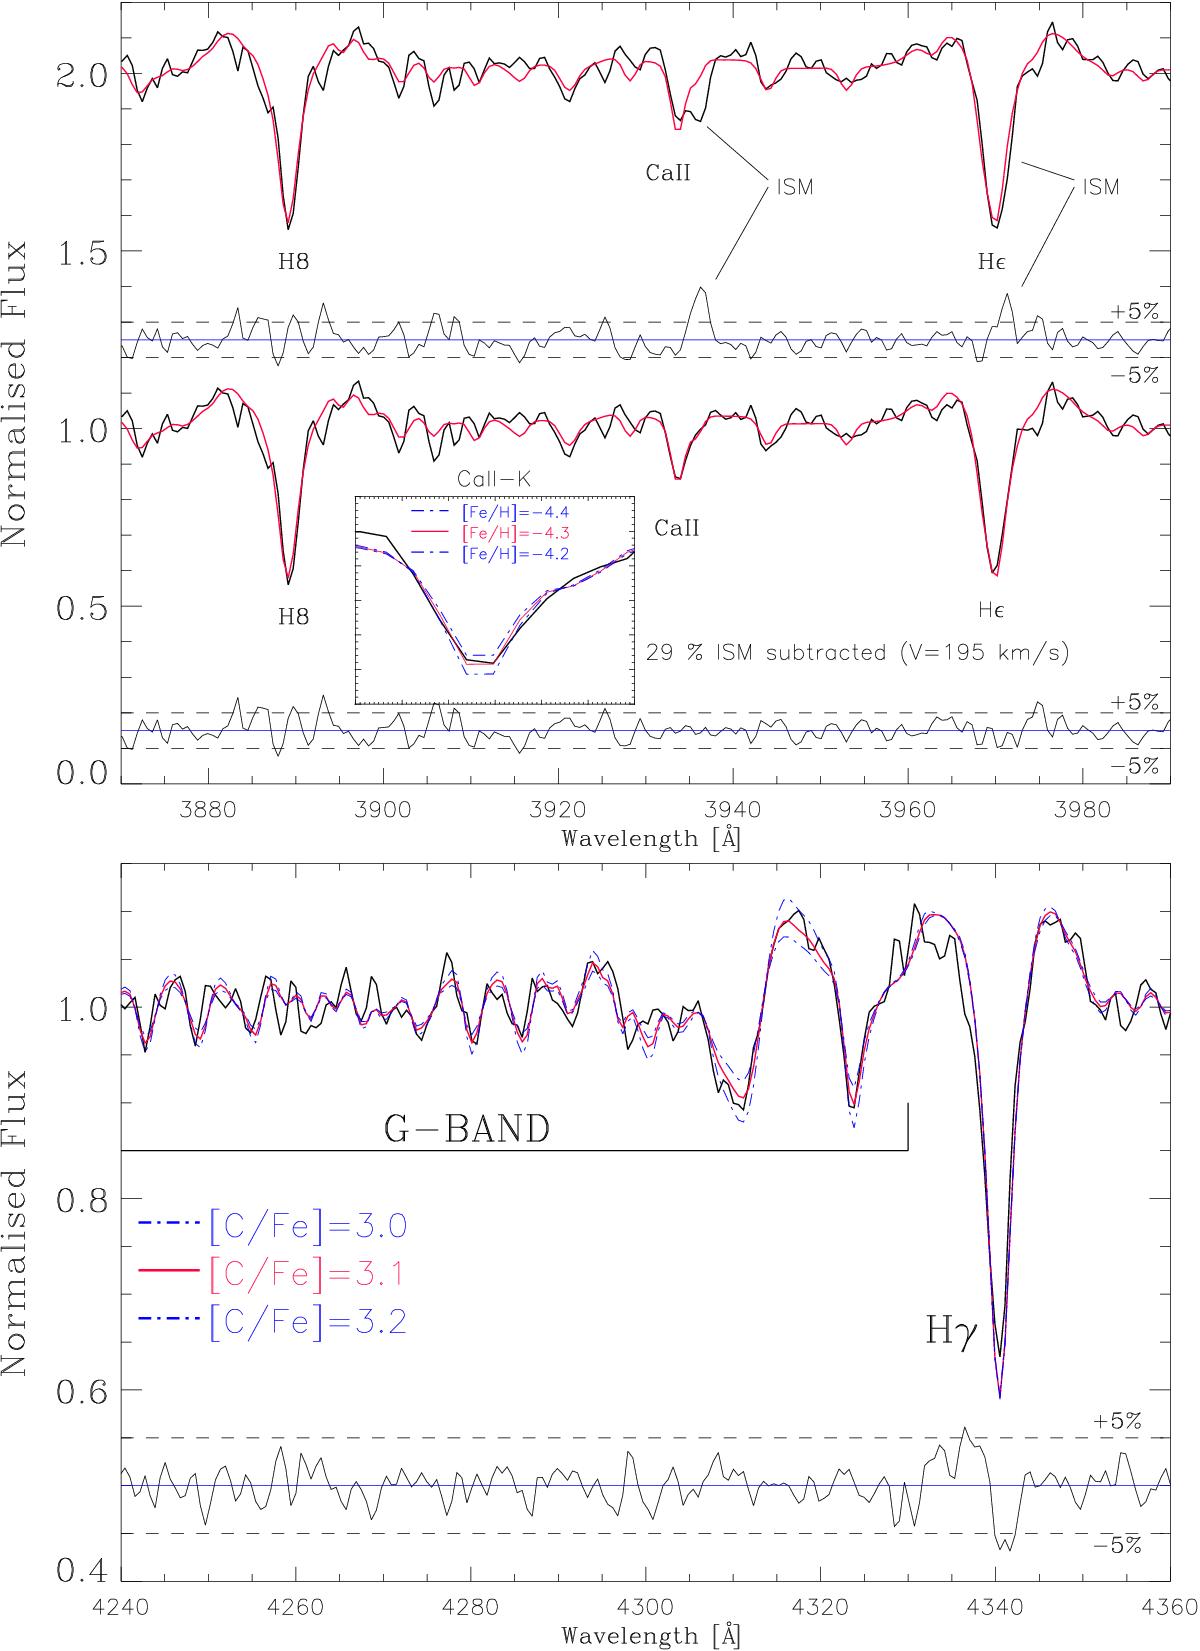
Upper panel: spectral range in the vicinity of the Ca ii H-K lines for the OSIRIS spectrum of the star J134157+513534 (black solid line) with the best fit (red line) before ISM subtraction (top panel) and after ISM subtraction (bottom panel). Below the spectra we display the residuals together with the + 5% and − 5% reference lines. A detail of the Ca ii K line after ISM subtraction with an upper and lower metallicity limit (dashed blue line) is plotted. Lower panel: spectral range of the G-band of the OSIRIS spectrum of J134157+513534 (black solid line) with the synthetic spectra for the best fit (red line), an upper and lower limit of carbon abundances (dashed blue line).
Current usage metrics show cumulative count of Article Views (full-text article views including HTML views, PDF and ePub downloads, according to the available data) and Abstracts Views on Vision4Press platform.
Data correspond to usage on the plateform after 2015. The current usage metrics is available 48-96 hours after online publication and is updated daily on week days.
Initial download of the metrics may take a while.