Fig. 2
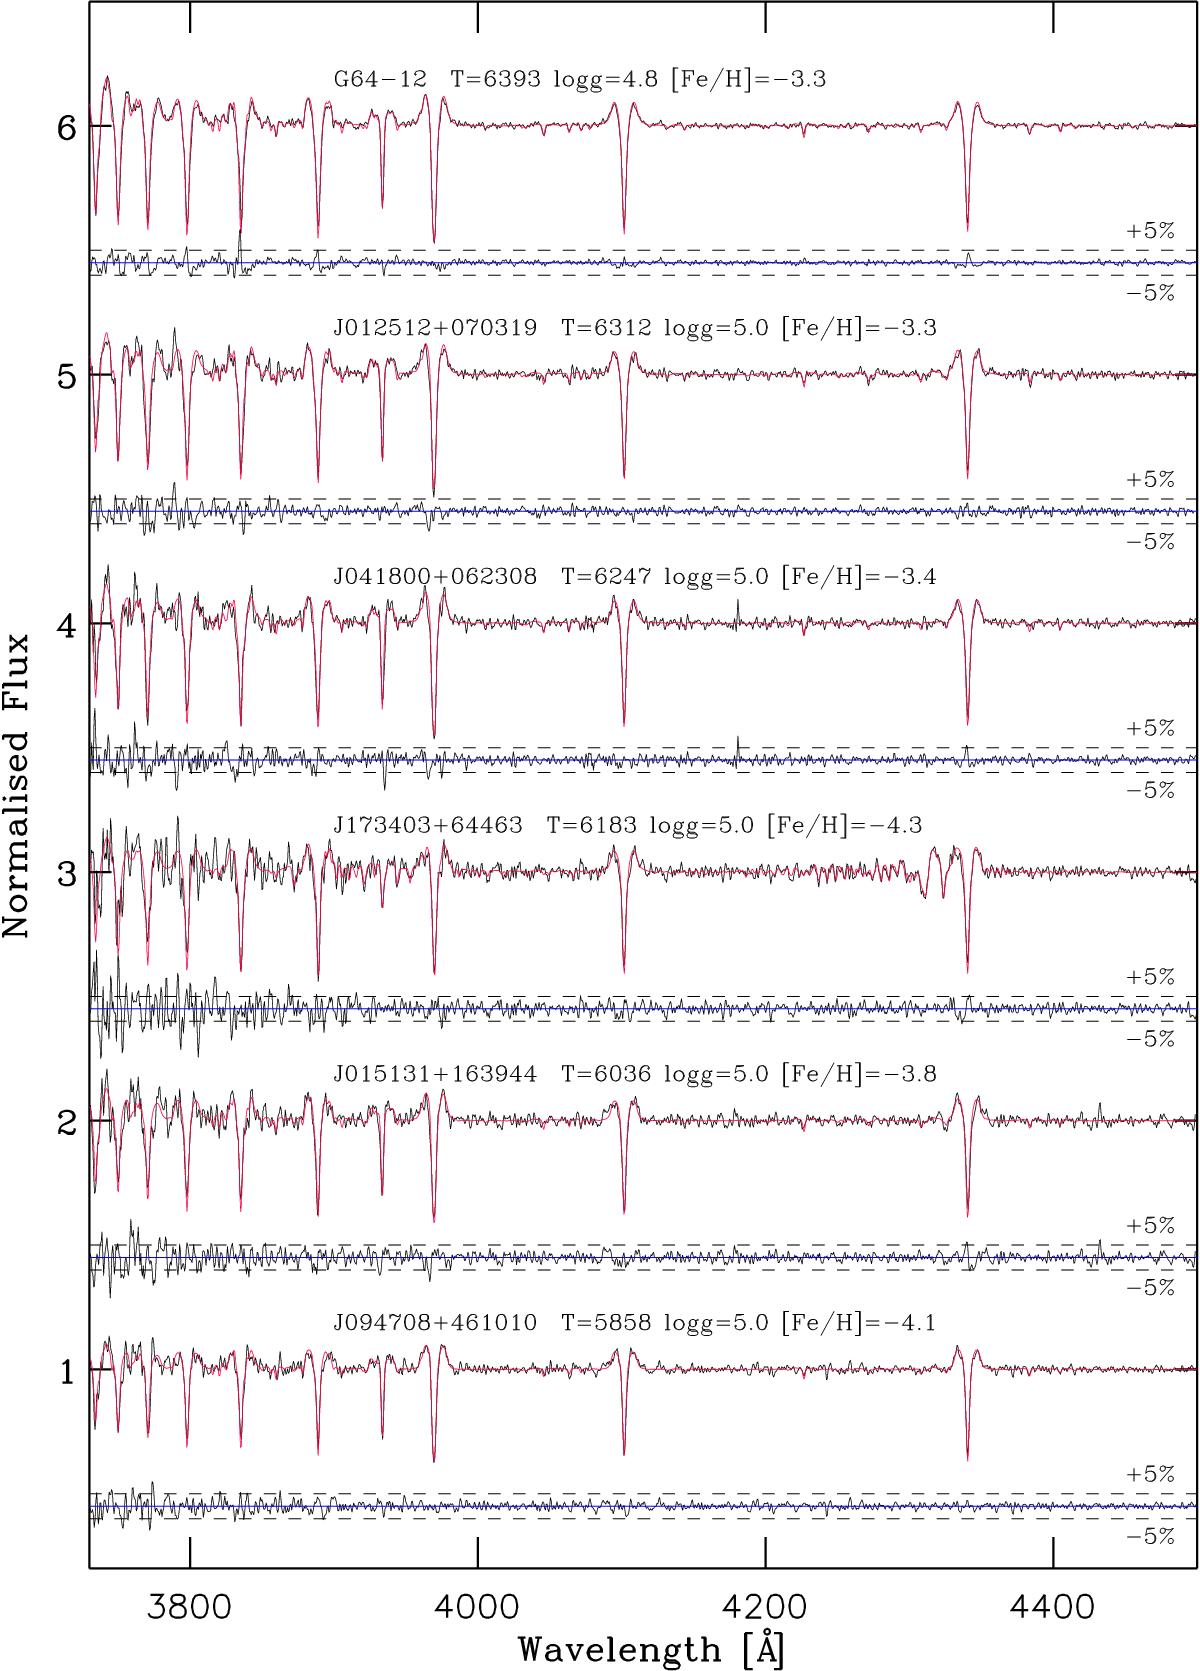
GTC/OSIRIS spectra (3700–4500 Å) our stellar sample (black line) and the best fit calculated with FERRE (red line). Under each of the spectra we also depict the residuals (difference between the observed spectrum and the best fit) together with the + 5% and − 5% reference lines. On top of each spectrum the main stellar parameters are displayed.
Current usage metrics show cumulative count of Article Views (full-text article views including HTML views, PDF and ePub downloads, according to the available data) and Abstracts Views on Vision4Press platform.
Data correspond to usage on the plateform after 2015. The current usage metrics is available 48-96 hours after online publication and is updated daily on week days.
Initial download of the metrics may take a while.